\n
## Chart: Language Model Loss vs. Computational Cost
### Overview
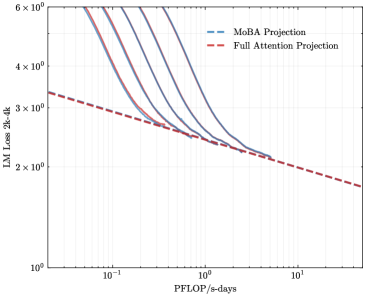
The image presents a chart comparing the Language Model (LM) Loss of two projection methods – MoBA Projection and Full Attention Projection – as a function of computational cost, measured in PFLOP/s-days. The chart uses a logarithmic scale for both axes. Several curves are plotted for each projection method, representing different runs or configurations.
### Components/Axes
* **X-axis:** PFLOP/s-days, labeled "PFLOP/s-days". The scale is logarithmic, ranging from approximately 10<sup>-1</sup> to 10<sup>1</sup>.
* **Y-axis:** LM Loss 2k-4k, labeled "LM Loss 2k-4k". The scale is logarithmic, ranging from approximately 10<sup>0</sup> to 6 x 10<sup>6</sup>.
* **Legend:** Located in the top-right corner.
* MoBA Projection: Represented by a dashed blue line. Multiple curves are plotted for this method.
* Full Attention Projection: Represented by a dashed red line. Multiple curves are plotted for this method.
### Detailed Analysis
**MoBA Projection (Blue Lines):**
There are approximately five blue dashed curves. All curves exhibit a steep downward slope initially, indicating a rapid decrease in LM Loss as PFLOP/s-days increase. As PFLOP/s-days increase, the rate of decrease slows down, and the curves begin to flatten.
* Curve 1: Starts at approximately (0.1, 5 x 10<sup>6</sup>) and decreases to approximately (10, 2 x 10<sup>2</sup>).
* Curve 2: Starts at approximately (0.1, 4 x 10<sup>6</sup>) and decreases to approximately (10, 1 x 10<sup>2</sup>).
* Curve 3: Starts at approximately (0.1, 3 x 10<sup>6</sup>) and decreases to approximately (10, 5 x 10<sup>1</sup>).
* Curve 4: Starts at approximately (0.1, 2 x 10<sup>6</sup>) and decreases to approximately (10, 2 x 10<sup>1</sup>).
* Curve 5: Starts at approximately (0.1, 1 x 10<sup>6</sup>) and decreases to approximately (10, 1 x 10<sup>1</sup>).
**Full Attention Projection (Red Lines):**
There are approximately three red dashed curves. These curves also show a downward trend, but the decrease in LM Loss is less pronounced than that of the MoBA Projection curves.
* Curve 1: Starts at approximately (0.1, 5 x 10<sup>5</sup>) and decreases to approximately (10, 2 x 10<sup>1</sup>).
* Curve 2: Starts at approximately (0.1, 4 x 10<sup>5</sup>) and decreases to approximately (10, 1 x 10<sup>1</sup>).
* Curve 3: Starts at approximately (0.1, 3 x 10<sup>5</sup>) and decreases to approximately (10, 5 x 10<sup>0</sup>).
### Key Observations
* MoBA Projection consistently achieves lower LM Loss values compared to Full Attention Projection across the entire range of PFLOP/s-days.
* The multiple curves for each projection method suggest variability in performance, potentially due to different initialization conditions, hyperparameters, or data subsets.
* The logarithmic scales emphasize the significant reduction in LM Loss achieved with increasing computational cost.
* The rate of improvement diminishes as computational cost increases, indicating diminishing returns.
### Interpretation
The chart demonstrates that MoBA Projection is more computationally efficient than Full Attention Projection in achieving a given level of LM Loss. For a given computational budget (PFLOP/s-days), MoBA Projection yields a lower loss, implying better model performance. The multiple curves for each method suggest that the performance is not deterministic and can vary. The diminishing returns observed at higher computational costs suggest that there is a point beyond which increasing the computational budget provides only marginal improvements in LM Loss. This information is crucial for resource allocation and model optimization, as it helps determine the optimal balance between computational cost and model accuracy. The use of logarithmic scales is appropriate for visualizing data that spans several orders of magnitude, as it allows for a clearer representation of the trends and relationships between the variables.