## Line Chart: Language Model Loss vs. Compute (Projected Scaling)
### Overview
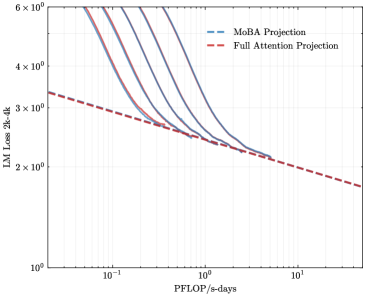
The image is a log-log line chart comparing the projected scaling performance of two different attention mechanisms for language models (LMs). It plots model loss against computational resources, showing that one method ("MoBA") is projected to achieve lower loss with the same compute compared to a "Full Attention" baseline.
### Components/Axes
* **Chart Type:** Log-Log Line Chart.
* **X-Axis:**
* **Label:** `PFLOP/s-days`
* **Scale:** Logarithmic, ranging from approximately `10^-1` (0.1) to `10^1` (10).
* **Markers:** Major ticks at `10^-1`, `10^0` (1), and `10^1`.
* **Y-Axis:**
* **Label:** `LM Loss 2k-4k`
* **Scale:** Logarithmic, ranging from `10^0` (1) to `6 x 10^0` (6).
* **Markers:** Major ticks at `10^0`, `2 x 10^0`, `3 x 10^0`, `4 x 10^0`, and `6 x 10^0`.
* **Legend:**
* **Position:** Top-right corner of the plot area.
* **Entry 1:** `MoBA Projection` - Represented by a blue dashed line (`--`).
* **Entry 2:** `Full Attention Projection` - Represented by a red dashed line (`--`).
* **Data Series (Unlabeled in Legend):**
* There are five solid lines in varying shades of blue/purple. These are not explicitly labeled in the legend but appear to represent specific model configurations or empirical data points that the projections are based on. They all follow a similar downward trend.
### Detailed Analysis
* **Trend Verification:**
* **All Solid Lines:** Each solid line slopes steeply downward from left to right, indicating that as computational resources (PFLOP/s-days) increase, the language model loss decreases significantly.
* **MoBA Projection (Blue Dashed Line):** This line has a negative slope, starting at a loss value of approximately `3.2` at `0.1 PFLOP/s-days` and decreasing to approximately `1.8` at `10 PFLOP/s-days`. It sits below the red dashed line for the entire visible range.
* **Full Attention Projection (Red Dashed Line):** This line also has a negative slope but is less steep than the MoBA projection. It starts at a loss of approximately `3.3` at `0.1 PFLOP/s-days` and decreases to approximately `1.8` at `10 PFLOP/s-days`. It converges with the MoBA projection line at the far right of the chart (~10 PFLOP/s-days).
* **Data Point Approximation (from visual inspection of the log scale):**
* At **~0.1 PFLOP/s-days**: The solid lines cluster between a loss of ~4.0 and >6.0 (off the top of the chart). The MoBA projection is at ~3.2, and the Full Attention projection is at ~3.3.
* At **~1 PFLOP/s-days**: The solid lines have converged and are near a loss of ~2.5. The MoBA projection is at ~2.3, and the Full Attention projection is at ~2.5.
* At **~10 PFLOP/s-days**: Both projection lines converge at a loss of approximately `1.8`.
### Key Observations
1. **Performance Gap:** The MoBA Projection line is consistently below the Full Attention Projection line across most of the compute range shown, suggesting a projected efficiency advantage for the MoBA method.
2. **Convergence:** The two projection lines appear to converge at very high compute levels (~10 PFLOP/s-days), indicating that the relative advantage of MoBA may diminish at extreme scale.
3. **Steep Empirical Scaling:** The solid, unlabeled lines show a very steep initial drop in loss, which then flattens as it approaches the projection lines. This is characteristic of scaling laws where initial gains are rapid.
4. **Log-Log Linearity:** The projections are approximately linear on this log-log plot, which is consistent with power-law scaling relationships commonly observed in neural network scaling.
### Interpretation
This chart presents a technical argument for the superior scaling efficiency of a "MoBA" (likely an acronym for a specific model architecture, e.g., "Mixture of Block Attention" or similar) compared to a standard "Full Attention" transformer baseline.
* **What the data suggests:** For a given budget of computational resources (PFLOP/s-days), a model using the MoBA architecture is projected to achieve a lower loss (i.e., better performance) than one using full attention. This implies MoBA could be a more cost-effective architecture for training large language models.
* **How elements relate:** The solid lines likely represent the performance of actual trained models at smaller scales. The dashed lines are extrapolations (projections) of these trends to larger compute budgets. The chart's core message is that the MoBA trend line (blue dashed) has a more favorable slope, leading to better-expected performance at scale.
* **Notable implications:** The convergence at the far right suggests there may be a fundamental limit to loss reduction where architectural differences matter less, or that the projection models assume similar asymptotic behavior. The primary takeaway is the projected **mid-range advantage** of MoBA, where it achieves the same loss as Full Attention with significantly less compute (e.g., to reach a loss of 2.5, MoBA requires ~0.7 PFLOP/s-days vs. Full Attention's ~1.0 PFLOP/s-days, a ~30% compute saving based on visual estimate). This has significant implications for the economics and feasibility of training next-generation AI models.