## Social Network Diagram: User Interactions
### Overview
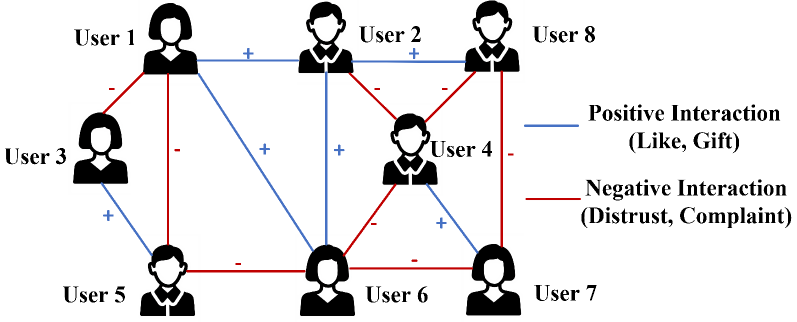
The image is a social network diagram illustrating interactions between eight users. The diagram uses nodes to represent users and edges to represent interactions. Blue lines indicate positive interactions (like, gift), while red lines indicate negative interactions (distrust, complaint). The diagram shows the relationships and sentiments between the users.
### Components/Axes
* **Nodes:** Represent individual users, labeled as User 1 through User 8. Each node is represented by a black silhouette of a person.
* **Edges:** Represent interactions between users.
* **Blue Lines:** Indicate positive interactions (like, gift). A "+" sign is placed near the blue lines.
* **Red Lines:** Indicate negative interactions (distrust, complaint). A "-" sign is placed near the red lines.
* **Legend:** Located on the right side of the diagram.
* Blue line: "Positive Interaction (Like, Gift)"
* Red line: "Negative Interaction (Distrust, Complaint)"
### Detailed Analysis
* **User 1:**
* Has a negative interaction with User 3 (red line, "-").
* Has a negative interaction with User 5 (red line, "-").
* Has a negative interaction with User 6 (red line, "-").
* Has a positive interaction with User 2 (blue line, "+").
* **User 2:**
* Has a positive interaction with User 1 (blue line, "+").
* Has a positive interaction with User 4 (blue line, "+").
* Has a negative interaction with User 4 (red line, "-").
* Has a positive interaction with User 8 (blue line, "+").
* **User 3:**
* Has a negative interaction with User 1 (red line, "-").
* Has a positive interaction with User 5 (blue line, "+").
* **User 4:**
* Has a positive interaction with User 2 (blue line, "+").
* Has a negative interaction with User 2 (red line, "-").
* Has a negative interaction with User 8 (red line, "-").
* Has a positive interaction with User 6 (blue line, "+").
* **User 5:**
* Has a negative interaction with User 1 (red line, "-").
* Has a positive interaction with User 3 (blue line, "+").
* Has a negative interaction with User 6 (red line, "-").
* **User 6:**
* Has a negative interaction with User 1 (red line, "-").
* Has a positive interaction with User 4 (blue line, "+").
* Has a negative interaction with User 5 (red line, "-").
* Has a negative interaction with User 7 (red line, "-").
* **User 7:**
* Has a negative interaction with User 6 (red line, "-").
* **User 8:**
* Has a positive interaction with User 2 (blue line, "+").
* Has a negative interaction with User 4 (red line, "-").
### Key Observations
* User 1 has only negative interactions.
* User 2 has only positive interactions.
* User 4 has both positive and negative interactions.
* User 6 has only negative interactions.
* User 7 has only negative interactions.
### Interpretation
The diagram represents a social network where interactions between users can be either positive (like, gift) or negative (distrust, complaint). The network shows a mix of positive and negative relationships, with some users having predominantly negative interactions (e.g., User 1, User 6, User 7) and others having predominantly positive interactions (e.g., User 2). User 4 seems to be in a central position, experiencing both positive and negative interactions with other users. The diagram could be used to analyze the sentiment and relationships within a social group, identify potential conflicts, or understand the flow of positive and negative influences.