# Technical Document Extraction: Social Interaction Network Diagram
## 1. Document Overview
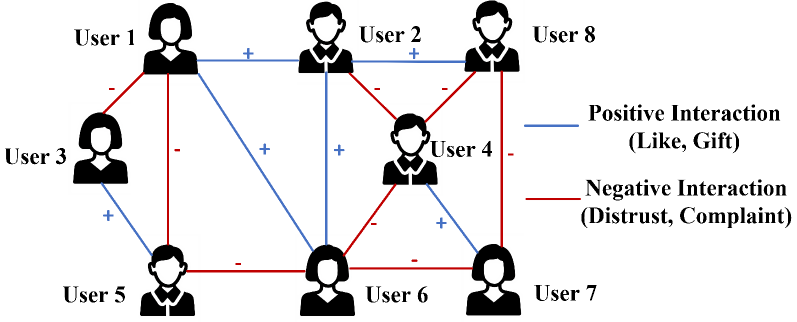
This image is a social network graph (node-edge diagram) illustrating the relationships between eight distinct users. The diagram uses color-coded and symbol-labeled edges to represent the nature of interactions between individuals.
## 2. Legend and Key Components
The legend is located in the middle-right section of the image.
| Visual Element | Label | Description/Examples |
| :--- | :--- | :--- |
| **Blue Line with '+'** | **Positive Interaction** | Like, Gift |
| **Red Line with '-'** | **Negative Interaction** | Distrust, Complaint |
### Node Identification
There are 8 nodes, represented by human silhouettes and labeled "User 1" through "User 8".
* **Female Silhouettes:** User 1, User 3, User 6, User 7.
* **Male Silhouettes:** User 2, User 4, User 5, User 8.
---
## 3. Network Topology and Interaction Data
The following table reconstructs the connections (edges) between users based on the spatial layout and color/symbol coding.
| Source Node | Target Node | Interaction Type | Symbol | Color |
| :--- | :--- | :--- | :--- | :--- |
| User 1 | User 2 | Positive | + | Blue |
| User 1 | User 3 | Negative | - | Red |
| User 1 | User 5 | Negative | - | Red |
| User 1 | User 6 | Positive | + | Blue |
| User 2 | User 4 | Negative | - | Red |
| User 2 | User 6 | Positive | + | Blue |
| User 2 | User 8 | Positive | + | Blue |
| User 3 | User 5 | Positive | + | Blue |
| User 4 | User 6 | Negative | - | Red |
| User 4 | User 7 | Positive | + | Blue |
| User 4 | User 8 | Negative | - | Red |
| User 5 | User 6 | Negative | - | Red |
| User 6 | User 7 | Negative | - | Red |
| User 7 | User 8 | Negative | - | Red |
---
## 4. Component Isolation and Spatial Analysis
### Region 1: Upper Tier (Users 1, 2, 8)
* **User 1 to User 2:** A horizontal blue line indicates a positive interaction.
* **User 2 to User 8:** A horizontal blue line indicates a positive interaction.
* *Trend:* The top row of the network is characterized primarily by positive horizontal connections.
### Region 2: Central/Diagonal Interactions
* **User 1 to User 6:** A long diagonal blue line (+) indicates a positive relationship spanning the height of the graph.
* **User 2 to User 4 & User 4 to User 8:** These form a "V" shape of red lines (-), indicating negative interactions centered on User 4 from the upper tier.
* **User 4 to User 6 & User 4 to User 7:** User 4 has a negative interaction with User 6 and a positive interaction with User 7.
### Region 3: Lower Tier (Users 3, 5, 6, 7)
* **User 3 to User 5:** A diagonal blue line (+) indicates a positive interaction.
* **User 5 to User 6:** A horizontal red line (-) indicates a negative interaction.
* **User 6 to User 7:** A horizontal red line (-) indicates a negative interaction.
* *Trend:* The bottom-right of the graph (Users 5, 6, 7) is dominated by negative horizontal interactions.
### Region 4: Vertical Interactions
* **User 1 to User 5:** A vertical red line (-) indicates a negative interaction.
* **User 2 to User 6:** A vertical blue line (+) indicates a positive interaction.
* **User 8 to User 7:** A vertical red line (-) indicates a negative interaction.
---
## 5. Summary of Findings
* **Total Nodes:** 8
* **Total Edges:** 14
* **Positive Edges (Blue):** 7
* **Negative Edges (Red):** 7
* **Most Connected Nodes:** User 1, User 2, User 4, and User 6 (4 connections each).
* **Least Connected Node:** User 3 (2 connections).