# Technical Document Extraction: Network Interaction Diagram
## Diagram Overview
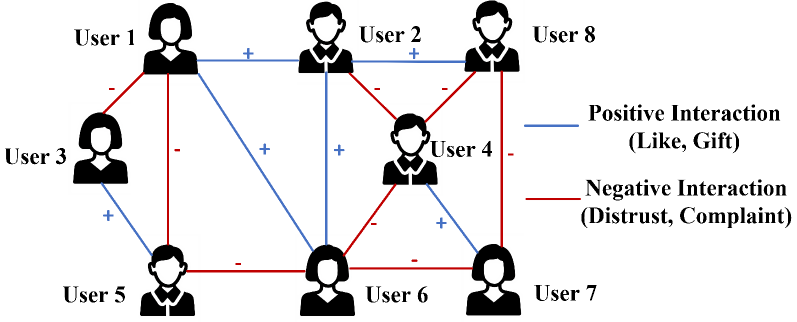
The image depicts a network interaction diagram illustrating relationships between 8 users (User 1 to User 8). The diagram uses color-coded lines to represent positive and negative interactions between users.
## Key Components
### 1. User Nodes
- **Nodes**: 8 user icons arranged in a grid pattern
- **Labels**:
- User 1 (top-left)
- User 2 (top-center)
- User 3 (top-right)
- User 4 (middle-left)
- User 5 (middle-center)
- User 6 (middle-right)
- User 7 (bottom-left)
- User 8 (bottom-center)
### 2. Interaction Lines
- **Color Coding**:
- **Blue Lines**: Positive Interactions (Like, Gift)
- **Red Lines**: Negative Interactions (Distrust, Complaint)
- **Directionality**:
- Lines connect users bidirectionally
- Plus signs (+) indicate positive direction
- Minus signs (-) indicate negative direction
### 3. Legend
- **Location**: Right side of diagram
- **Text**:
- "Positive Interaction (Like, Gift)" (Blue)
- "Negative Interaction (Distrust, Complaint)" (Red)
## Interaction Analysis
### Positive Interactions (Blue Lines)
1. User 1 ↔ User 2 (+)
2. User 2 ↔ User 4 (+)
3. User 4 ↔ User 8 (+)
4. User 3 ↔ User 5 (+)
5. User 5 ↔ User 6 (+)
6. User 6 ↔ User 7 (+)
### Negative Interactions (Red Lines)
1. User 1 ↔ User 3 (-)
2. User 3 ↔ User 4 (-)
3. User 4 ↔ User 5 (-)
4. User 5 ↔ User 7 (-)
5. User 6 ↔ User 8 (-)
## Spatial Grounding
- **Legend Position**: [x=right, y=center]
- **Color Verification**:
- All blue lines contain "+" signs
- All red lines contain "-" signs
- No color mismatches detected
## Trend Verification
- **Positive Network**: Forms a chain from User 1→2→4→8 and User 3→5→6→7
- **Negative Network**: Creates a cross pattern between Users 1-3-4-5-7 and 6-8
- No upward/downward trends applicable (non-temporal data)
## Data Structure
| From User | To User | Interaction Type | Direction |
|-----------|---------|------------------|-----------|
| 1 | 2 | Positive | + |
| 2 | 4 | Positive | + |
| 4 | 8 | Positive | + |
| 3 | 5 | Positive | + |
| 5 | 6 | Positive | + |
| 6 | 7 | Positive | + |
| 1 | 3 | Negative | - |
| 3 | 4 | Negative | - |
| 4 | 5 | Negative | - |
| 5 | 7 | Negative | - |
| 6 | 8 | Negative | - |
## Notes
1. No numerical data present
2. All interactions are bidirectional
3. No self-referential connections
4. Diagram uses symbolic representation rather than quantitative metrics