## Chart: Colorings Count Distribution
### Overview
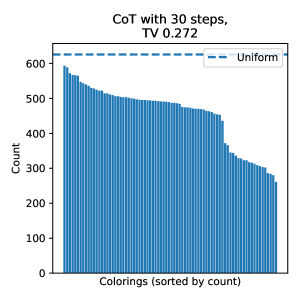
The image is a bar chart showing the distribution of colorings, sorted by count. The chart title indicates "CoT with 30 steps, TV 0.272". A horizontal dashed line represents a uniform distribution.
### Components/Axes
* **Title:** CoT with 30 steps, TV 0.272
* **Y-axis:** Count, ranging from 0 to 600.
* **X-axis:** Colorings (sorted by count)
* **Legend:** Located in the top-right corner, indicating "Uniform" represented by a dashed blue line.
### Detailed Analysis
* **Bar Chart:** The bar chart displays the count of each coloring. The bars are sorted in descending order of count.
* The highest count is approximately 590.
* The counts gradually decrease from left to right.
* The lowest count is approximately 250.
* **Uniform Distribution Line:** A dashed blue line represents a uniform distribution. It is positioned at a count of approximately 630.
### Key Observations
* The distribution of colorings is not uniform.
* The counts are concentrated towards higher values, with a long tail towards lower values.
### Interpretation
The chart illustrates the distribution of colorings obtained after 30 steps of a process (likely a Chain-of-Thought process, as indicated by "CoT"). The "TV 0.272" likely refers to the Total Variation distance, quantifying the difference between the observed distribution and a uniform distribution. The fact that the observed distribution deviates significantly from the uniform distribution suggests that the process favors certain colorings over others. The decreasing trend in the bar chart indicates that some colorings are much more frequent than others.