## Bar Chart: CoT with 30 steps, TV 0.272
### Overview
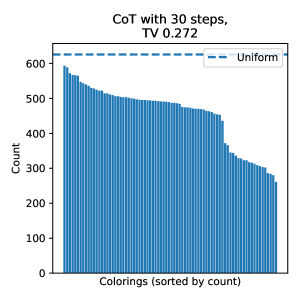
This is a vertical bar chart displaying the frequency distribution of "Colorings" from an experiment or simulation involving a Chain-of-Thought (CoT) process with 30 steps. The chart compares the observed counts of various colorings against a theoretical uniform distribution baseline. The title includes a metric "TV 0.272," which likely stands for Total Variation distance.
### Components/Axes
* **Title:** "CoT with 30 steps, TV 0.272" (Centered at the top).
* **Y-Axis:**
* **Label:** "Count" (Vertical text on the left side).
* **Scale:** Linear scale from 0 to 600, with major tick marks at 0, 100, 200, 300, 400, 500, and 600.
* **X-Axis:**
* **Label:** "Colorings (sorted by count)" (Centered at the bottom).
* **Scale:** Categorical. Each bar represents a distinct "coloring." The categories are sorted in descending order of their count from left to right.
* **Legend:**
* **Label:** "Uniform"
* **Visual:** A horizontal dashed blue line.
* **Placement:** Top-right corner of the chart area.
* **Data Series:**
* A single series of vertical blue bars representing the "Count" for each "Coloring."
### Detailed Analysis
* **Uniform Baseline:** The dashed "Uniform" line is positioned at a count of approximately **620**. This represents the expected count if all colorings occurred with equal frequency.
* **Data Distribution (Trend Verification):** The bars exhibit a clear, monotonically decreasing trend from left to right.
* The **leftmost bar** (the most frequent coloring) has a height of approximately **600**, just below the uniform line.
* The bars decrease gradually in height across the majority of the chart. By the midpoint, the count is approximately **480**.
* A **notable drop** occurs in the rightmost quarter of the chart. The counts fall more steeply from around **450** to below **300**.
* The **rightmost bar** (the least frequent coloring) has a height of approximately **280**.
* **Spatial Grounding:** The legend is placed in the top-right, overlapping slightly with the upper portion of the bars. The uniform line extends horizontally across the entire width of the plot area at its designated y-value.
### Key Observations
1. **Non-Uniform Distribution:** The observed counts for all colorings are below the uniform baseline (620). No coloring reaches the expected frequency of a perfectly uniform distribution.
2. **Significant Skew:** The distribution is heavily skewed. A small number of colorings on the left have counts near 600, while a larger number of colorings on the right have counts below 350.
3. **Steep Tail:** The sharp decline in the rightmost section indicates a "long tail" of colorings that occur much less frequently than the most common ones.
4. **Total Variation (TV):** The stated TV of 0.272 quantifies the overall difference between this observed distribution and the uniform distribution. A value of 0 would be a perfect match; 0.272 indicates a moderate to substantial deviation.
### Interpretation
This chart visualizes the outcome of a stochastic process (CoT with 30 steps) applied to a combinatorial problem involving "colorings." The key insight is that the process does **not** generate outcomes uniformly. Instead, it exhibits a strong bias:
* **Favored Outcomes:** A subset of colorings (left side) is generated relatively frequently, approaching but not reaching the theoretical uniform rate.
* **Disfavored Outcomes:** A larger subset of colorings (right side) is generated significantly less often, with some being quite rare.
The **Total Variation distance of 0.272** is a critical metric. It suggests the CoT process has a measurable and non-trivial preference structure. This could be due to the inherent logic of the 30-step process, the structure of the problem space, or biases in the step-by-step reasoning. The "sorted by count" presentation makes this inequality immediately visible, highlighting that the process is not exploring the solution space evenly. For a technical audience, this indicates that conclusions drawn from samples generated by this process may be biased towards the more frequent colorings on the left.