## Timeline Diagram: Diffusion Model Evolution
### Overview
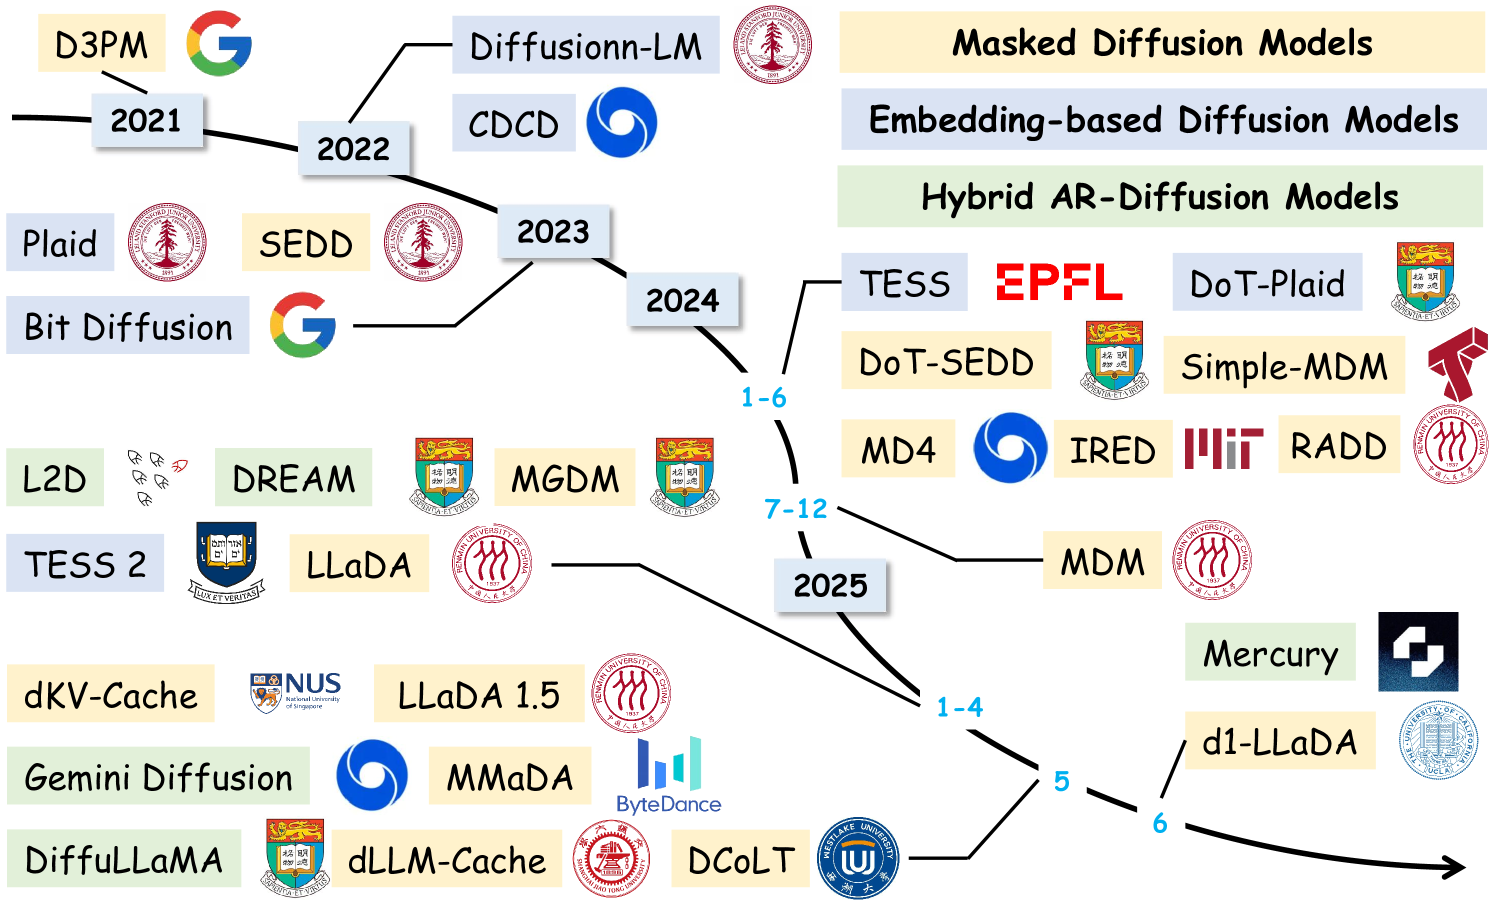
The image is a timeline diagram illustrating the evolution of diffusion models from 2021 to 2025. It shows different models, their associated institutions/companies, and categorizes them into different types of diffusion models. The diagram uses a branching structure to represent the progression of research and development in this field.
### Components/Axes
* **Timeline:** The timeline spans from 2021 to 2025, with each year acting as a major node in the diagram.
* **Diffusion Models:** Various diffusion models are listed, each associated with a specific year and often an institution or company logo.
* **Categories:** The diagram highlights different categories of diffusion models: Masked Diffusion Models, Embedding-based Diffusion Models, and Hybrid AR-Diffusion Models. These categories are highlighted with different background colors.
* **Institutions/Companies:** Logos of various institutions and companies involved in the development of these models are included.
* **Branching Structure:** Lines connect the years and models, indicating the flow of research and development.
### Detailed Analysis or ### Content Details
**2021**
* **D3PM:** Associated with a Google logo. Located at the top-left.
* **Plaid:** Associated with the Stanford University logo. Located below D3PM.
* **Bit Diffusion:** Associated with a Google logo. Located below Plaid.
* **L2D:** Associated with a small icon of multiple red birds. Located below Bit Diffusion.
**2022**
* **Diffusionn-LM:** Associated with the Stanford University logo. Located at the top-right.
* **CDCD:** Associated with a blue circle logo. Located below Diffusionn-LM.
* **SEDD:** Associated with the Stanford University logo. Located below Diffusionn-LM and to the right of Plaid.
* **DREAM:** Associated with no logo. Located below SEDD and to the right of L2D.
* **TESS 2:** Associated with the Yale University logo. Located below DREAM.
**2023**
* **MGDM:** Associated with the Chinese University of Hong Kong logo. Located to the right of DREAM.
* **LLaDA:** Associated with the Renmin University of China logo. Located below MGDM.
* **dKV-Cache:** Associated with no logo. Located below TESS 2.
* **Gemini Diffusion:** Associated with a green background. Located below dKV-Cache.
* **DiffuLLaMA:** Associated with the National University of Singapore logo. Located below Gemini Diffusion.
**2024**
* **TESS:** Associated with the EPFL logo. Located to the right of SEDD.
* **DoT-Plaid:** Associated with the National University of Singapore logo. Located to the right of TESS.
* **DoT-SEDD:** Associated with the Chinese University of Hong Kong logo. Located below TESS.
* **MD4:** Associated with a blue circle logo. Located below DoT-SEDD.
* **IRED:** Associated with the MIT logo. Located to the right of MD4.
* **LLaDA 1.5:** Associated with the Renmin University of China logo. Located below LLaDA.
* **MMaDA:** Associated with the ByteDance logo. Located below LLaDA 1.5.
* **dLLM-Cache:** Associated with the Shanghai Jiao Tong University logo. Located below DiffuLLaMA.
**2025**
* **Simple-MDM:** Associated with the logo of the company T. Located to the right of DoT-Plaid.
* **RADD:** Associated with the Renmin University of China logo. Located to the right of IRED.
* **MDM:** Associated with the Renmin University of China logo. Located below MD4.
* **Mercury:** Associated with a dark square logo. Located to the right of MDM.
* **DCOLT:** Associated with the Westlake University logo. Located below MMaDA.
* **d1-LLaDA:** Associated with the UCLA logo. Located below Mercury.
**Categories:**
* **Masked Diffusion Models:** Located at the top-right.
* **Embedding-based Diffusion Models:** Located below Masked Diffusion Models.
* **Hybrid AR-Diffusion Models:** Located below Embedding-based Diffusion Models.
**Branches:**
* A branch labeled "1-6" connects 2024 to 2025.
* A branch labeled "7-12" connects 2024 to 2025.
* A branch labeled "1-4" connects 2025 to the bottom row.
* Branches labeled "5" and "6" connect 2025 to the bottom row.
### Key Observations
* The diagram shows a clear progression of diffusion models over time.
* Several models are associated with specific institutions and companies, indicating their involvement in the research and development of these models.
* The branching structure suggests that research in diffusion models is diversifying and leading to different paths of development.
* Renmin University of China appears to be heavily involved in the development of diffusion models, with multiple models associated with their logo.
### Interpretation
The timeline diagram provides a visual representation of the evolution of diffusion models, highlighting the key players, categories, and progression of research in this field. The diagram suggests that the field is rapidly evolving, with new models and approaches being developed each year. The involvement of various institutions and companies indicates the growing interest and investment in diffusion models. The branching structure suggests that the field is becoming more diverse, with different research groups exploring different avenues of development. The diagram is useful for understanding the history and current state of diffusion models and for identifying potential areas for future research.