## Heatmap: MIND - Core Generalization - Qwen-2.5 3B
### Overview
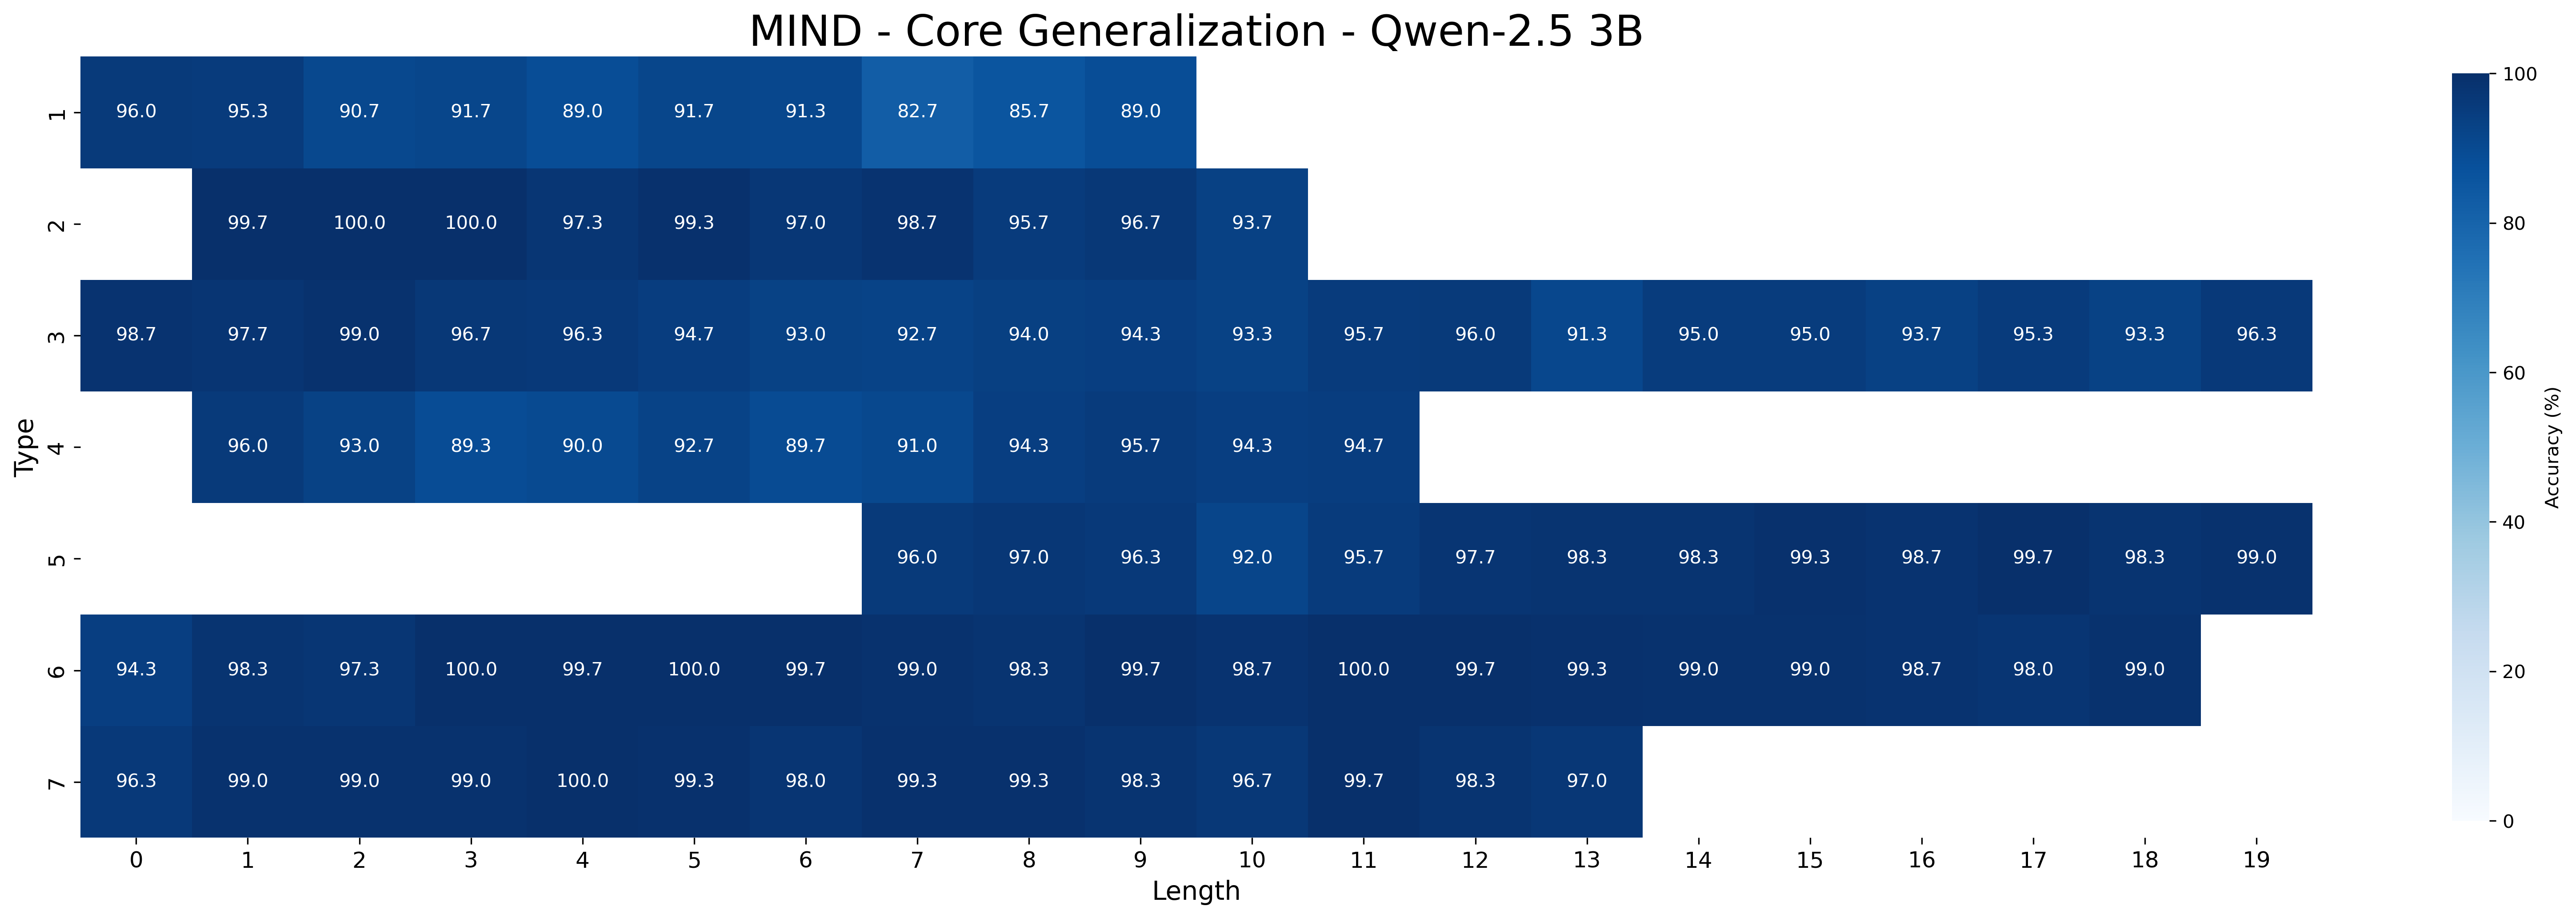
The image is a heatmap visualizing the core generalization performance of the MIND model using Qwen-2.5 3B. The heatmap displays accuracy percentages across different "Type" categories (1 to 7) and sequence "Length" (0 to 19). The color intensity represents the accuracy, with darker blue indicating higher accuracy and lighter blue indicating lower accuracy.
### Components/Axes
* **Title:** MIND - Core Generalization - Qwen-2.5 3B
* **Y-axis:** "Type" (categorical), labeled 1 to 7.
* **X-axis:** "Length" (numerical), ranging from 0 to 19.
* **Colorbar (right side):** "Accuracy (%)", ranging from 0 to 100, with a gradient from light blue (0%) to dark blue (100%).
### Detailed Analysis
The heatmap presents accuracy values for each combination of "Type" and "Length." Here's a breakdown of the data:
* **Type 1:**
* Length 0: 96.0%
* Length 1: 95.3%
* Length 2: 90.7%
* Length 3: 91.7%
* Length 4: 89.0%
* Length 5: 91.7%
* Length 6: 91.3%
* Length 7: 82.7%
* Length 8: 85.7%
* Length 9: 89.0%
* **Type 2:**
* Length 0: 99.7%
* Length 1: 100.0%
* Length 2: 100.0%
* Length 3: 97.3%
* Length 4: 99.3%
* Length 5: 97.0%
* Length 6: 98.7%
* Length 7: 95.7%
* Length 8: 96.7%
* Length 9: 93.7%
* **Type 3:**
* Length 0: 98.7%
* Length 1: 97.7%
* Length 2: 99.0%
* Length 3: 96.7%
* Length 4: 96.3%
* Length 5: 94.7%
* Length 6: 93.0%
* Length 7: 92.7%
* Length 8: 94.0%
* Length 9: 94.3%
* Length 10: 93.3%
* Length 11: 95.7%
* Length 12: 96.0%
* Length 13: 91.3%
* Length 14: 95.0%
* Length 15: 95.0%
* Length 16: 93.7%
* Length 17: 95.3%
* Length 18: 93.3%
* Length 19: 96.3%
* **Type 4:**
* Length 0: 96.0%
* Length 1: 93.0%
* Length 2: 89.3%
* Length 3: 90.0%
* Length 4: 92.7%
* Length 5: 89.7%
* Length 6: 91.0%
* Length 7: 94.3%
* Length 8: 95.7%
* Length 9: 94.3%
* Length 10: 94.7%
* **Type 5:**
* Length 7: 96.0%
* Length 8: 97.0%
* Length 9: 96.3%
* Length 10: 92.0%
* Length 11: 95.7%
* Length 12: 97.7%
* Length 13: 98.3%
* Length 14: 98.3%
* Length 15: 99.3%
* Length 16: 98.7%
* Length 17: 99.7%
* Length 18: 98.3%
* Length 19: 99.0%
* **Type 6:**
* Length 0: 94.3%
* Length 1: 98.3%
* Length 2: 97.3%
* Length 3: 100.0%
* Length 4: 99.7%
* Length 5: 100.0%
* Length 6: 99.7%
* Length 7: 99.0%
* Length 8: 98.3%
* Length 9: 99.7%
* Length 10: 98.7%
* Length 11: 100.0%
* Length 12: 99.7%
* Length 13: 99.3%
* Length 14: 99.0%
* Length 15: 99.0%
* Length 16: 98.7%
* Length 17: 98.0%
* Length 18: 99.0%
* **Type 7:**
* Length 0: 96.3%
* Length 1: 99.0%
* Length 2: 99.0%
* Length 3: 99.0%
* Length 4: 100.0%
* Length 5: 99.3%
* Length 6: 98.0%
* Length 7: 99.3%
* Length 8: 99.3%
* Length 9: 98.3%
* Length 10: 96.7%
* Length 11: 99.7%
* Length 12: 98.3%
* Length 13: 97.0%
### Key Observations
* Types 2, 6, and 7 generally exhibit higher accuracy across different lengths compared to Types 1, 3, 4, and 5.
* Accuracy tends to vary more for shorter sequence lengths (0-5) and stabilizes or increases for longer lengths, especially for Types 5, 6, and 7.
* Type 1 shows a decreasing trend in accuracy as the length increases from 0 to 7, then a slight increase.
* Type 4 has lower accuracy compared to other types, especially for lengths 2, 3, and 5.
### Interpretation
The heatmap illustrates the performance of the MIND model with Qwen-2.5 3B on core generalization tasks. The "Type" likely represents different task categories or data distributions. The results suggest that the model performs better on certain types of tasks (Types 2, 6, and 7) and that performance can be influenced by the sequence length. The lower accuracy for Type 1 with increasing length might indicate a limitation in handling longer sequences for that specific task. The consistently high accuracy for Types 6 and 7 suggests that the model is robust for those tasks, regardless of sequence length. The data could be used to identify areas where the model needs improvement, particularly for tasks represented by Types 1 and 4, and to optimize performance based on sequence length.