## Heatmap: MIND - Core Generalization - Qwen-2.5 3B
### Overview
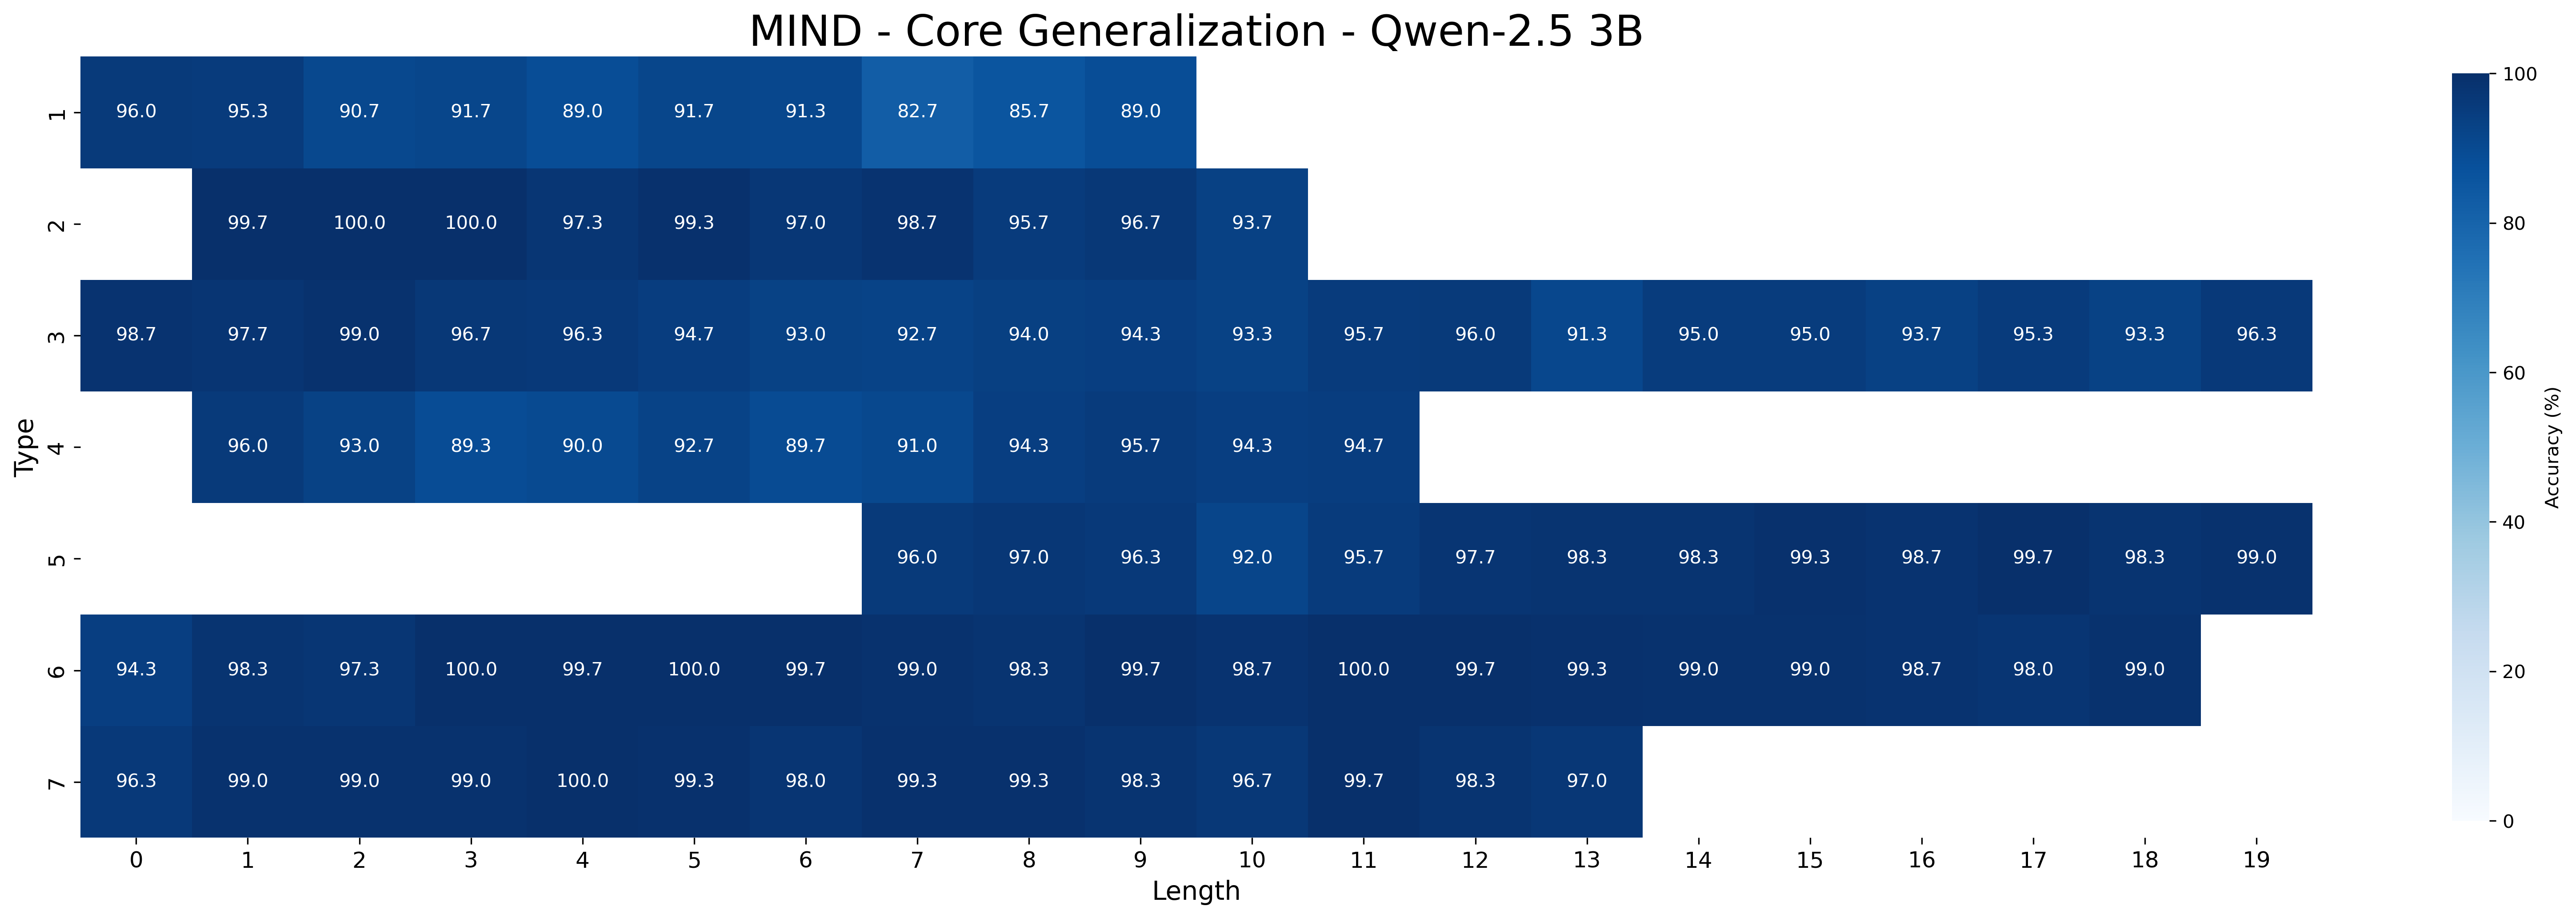
This image presents a heatmap visualizing the accuracy of a model (Qwen-2.5 3B) on the MIND dataset, specifically focusing on core generalization performance. The heatmap displays accuracy as a function of 'Type' and 'Length'. The color intensity represents the accuracy percentage, with darker shades indicating higher accuracy.
### Components/Axes
* **Title:** MIND - Core Generalization - Qwen-2.5 3B (Top-center)
* **X-axis:** Length (ranging from 0 to 19, with integer values)
* **Y-axis:** Type (with categories: 'I', '2', 'M', '4', 'U', '>')
* **Color Scale/Legend:** A vertical color bar on the right side, representing Accuracy (%) ranging from 0 to 100. The color gradient transitions from light blue (low accuracy) to dark blue (high accuracy).
### Detailed Analysis
The heatmap is a 6x20 grid, with each cell representing the accuracy for a specific combination of 'Type' and 'Length'. I will analyze each row (Type) and describe the trend of accuracy across the 'Length' axis.
* **Type 'I'**: Accuracy starts at approximately 96.0% for Length 0, increases slightly to around 97.0% at Length 2, then decreases to approximately 82.7% at Length 6, and recovers to around 89.0% at Length 19.
* **Type '2'**: Accuracy is very high, starting at 99.7% for Length 0, remaining consistently high (around 95.7% to 97.3%) across all lengths up to 19.
* **Type 'M'**: Accuracy begins at 98.7% for Length 0, decreases to approximately 94.7% at Length 5, then increases again to around 96.3% at Length 2, and remains relatively stable around 95.0% to 96.3% for Lengths 8 to 19.
* **Type '4'**: Accuracy starts at 96.0% for Length 0, decreases to approximately 89.0% at Length 3, then increases to around 94.3% at Length 9, and remains relatively stable around 94.7% for Lengths 10 to 19.
* **Type 'U'**: Accuracy starts at 96.0% for Length 0, increases to approximately 97.0% at Length 6, then decreases to around 92.3% at Length 10, and recovers to around 98.3% to 99.0% for Lengths 14 to 19.
* **Type '>'**: Accuracy is consistently high, starting at 99.3% for Length 0, remaining above 97.0% across all lengths, and reaching 100.0% at Length 5 and Length 11.
Here's a more detailed breakdown of specific values (approximate):
| Type | Length 0 | Length 1 | Length 2 | Length 3 | Length 4 | Length 5 | Length 6 | Length 7 | Length 8 | Length 9 | Length 10 | Length 11 | Length 12 | Length 13 | Length 14 | Length 15 | Length 16 | Length 17 | Length 18 | Length 19 |
|---|---|---|---|---|---|---|---|---|---|---|---|---|---|---|---|---|---|---|---|---|
| I | 96.0 | 96.3 | 90.7 | 89.0 | 91.7 | 82.7 | 85.7 | 89.0 | | | | | | | | | | | | |
| 2 | 99.7 | 100.0 | 90.3 | 99.3 | 97.0 | 95.7 | 96.7 | 93.7 | | | | | | | | | | | | |
| M | 98.7 | 99.0 | 96.7 | 96.3 | 94.7 | 92.0 | 94.0 | 94.3 | 95.7 | 96.0 | 95.0 | 95.0 | 95.3 | 93.3 | 96.3 | | | | | |
| 4 | 96.0 | 93.0 | 89.0 | 90.0 | 92.7 | 89.7 | 91.0 | 94.3 | 95.7 | 94.7 | | | | | | | | | | |
| U | | | | | | 96.0 | 97.0 | 96.2 | 95.7 | 97.3 | 98.3 | 98.3 | 98.7 | 99.7 | 98.3 | 99.0 | | | | |
| > | 99.3 | 99.0 | 100.0 | 99.7 | 99.0 | 99.3 | 99.3 | 98.7 | 99.7 | 98.3 | 99.0 | 97.0 | | | | | | | | |
### Key Observations
* Type '2' and '>' consistently exhibit the highest accuracy across all lengths.
* Type 'I' shows the most significant fluctuation in accuracy with increasing length, experiencing a dip around Length 6.
* Type '4' also shows a decrease in accuracy for shorter lengths, but recovers somewhat at longer lengths.
* The model generally performs well (accuracy > 90%) across most Type/Length combinations.
### Interpretation
The heatmap demonstrates the generalization performance of the Qwen-2.5 3B model on the MIND dataset. The consistent high accuracy for Types '2' and '>' suggests the model is particularly adept at handling those specific types of input. The fluctuations observed in Types 'I' and '4' indicate that the model's performance is more sensitive to the length of the input for these types. The dip in accuracy for Type 'I' at Length 6 could be due to a specific characteristic of the data at that length, or a limitation in the model's ability to process inputs of that length for that type. Overall, the heatmap provides a valuable visual representation of the model's strengths and weaknesses, allowing for targeted improvements and further investigation. The data suggests that the model is generally robust, but specific types and lengths require further attention to optimize performance.