## Heatmap: MIND - Core Generalization - Qwen-2.5 3B
### Overview
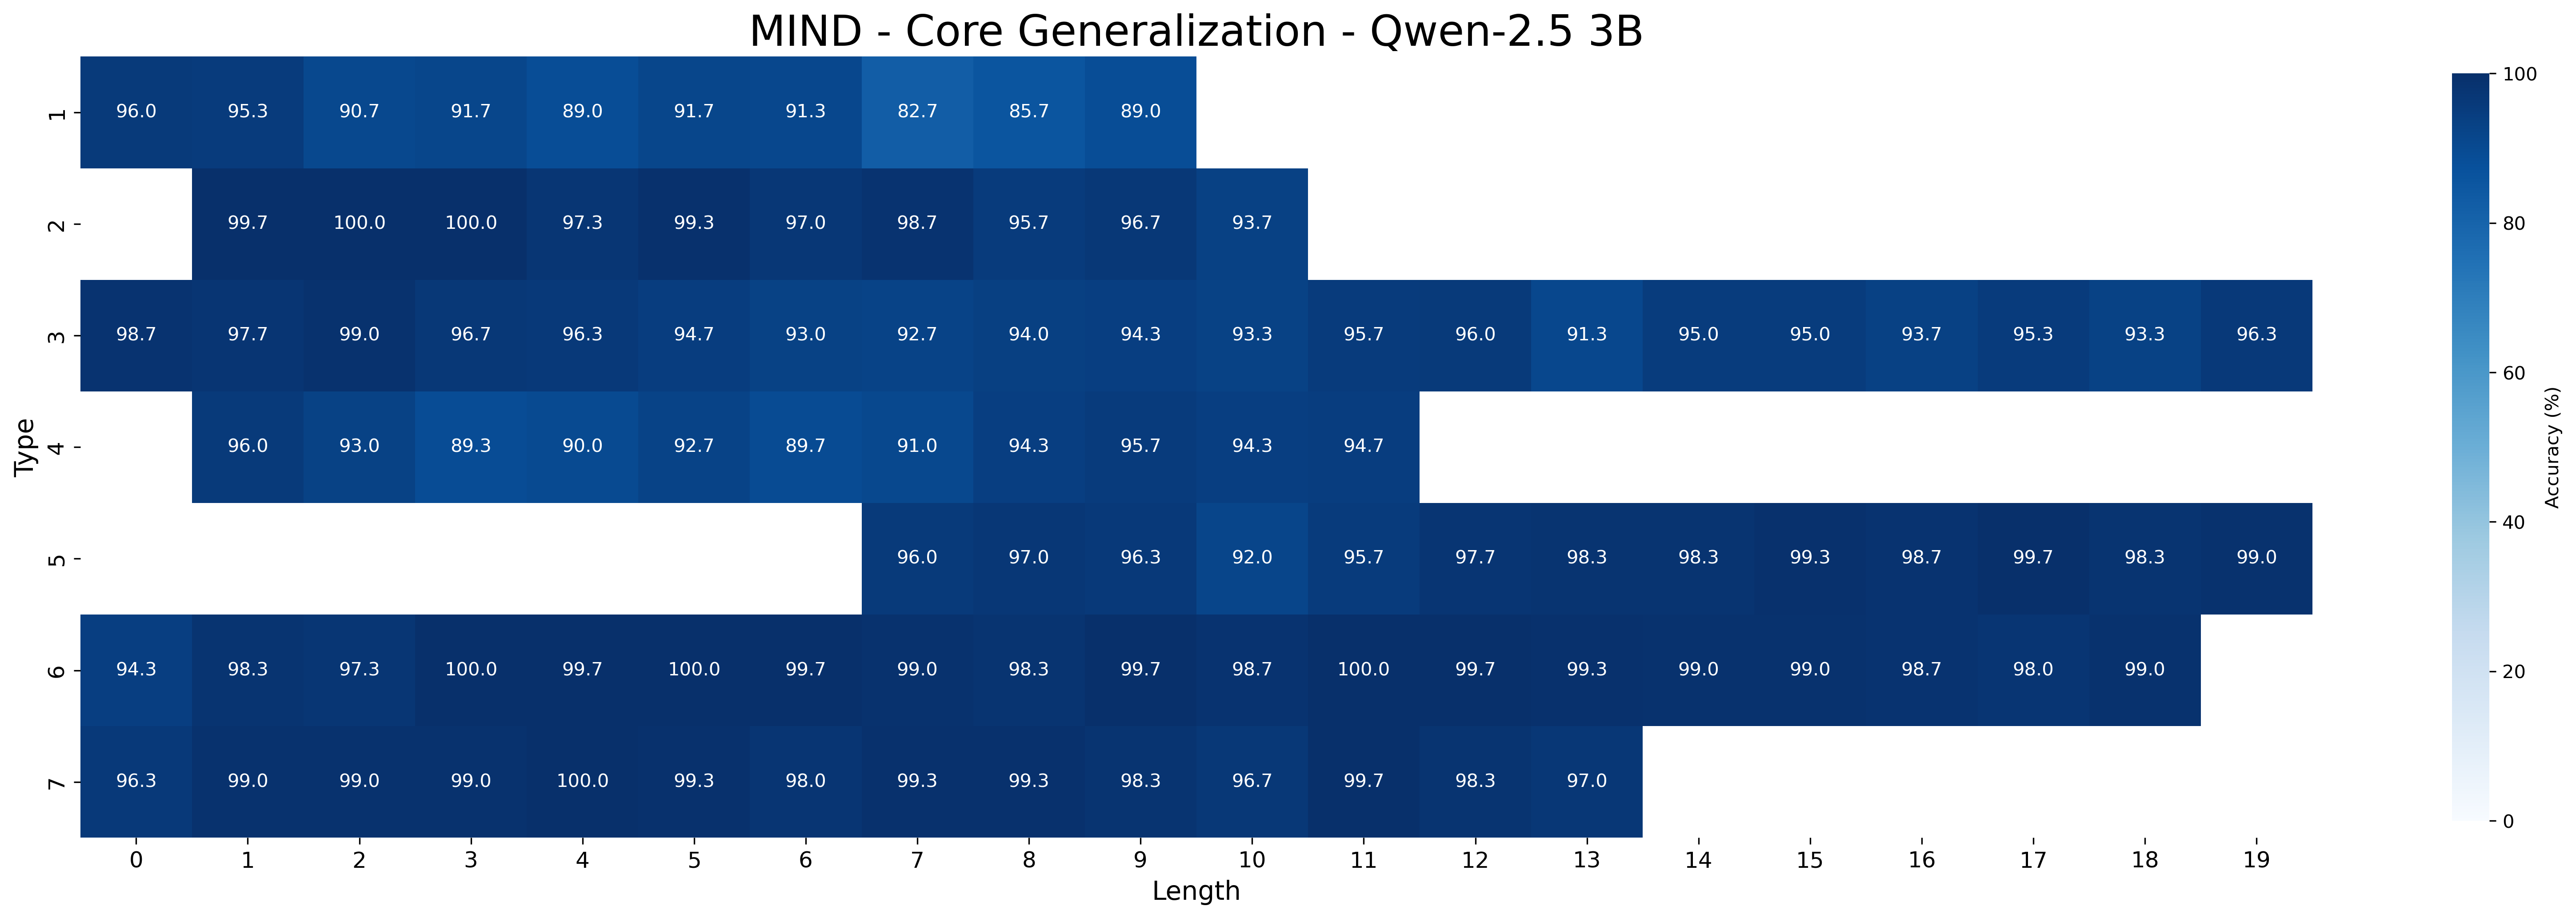
This image is a heatmap visualizing the performance accuracy (in percentage) of a model named "Qwen-2.5 3B" on a task or benchmark called "MIND - Core Generalization". The heatmap plots performance across two dimensions: "Type" (y-axis) and "Length" (x-axis). The color intensity represents accuracy, with a scale from 0% (lightest blue/white) to 100% (darkest blue). The chart contains numerical accuracy values within each colored cell.
### Components/Axes
* **Title:** "MIND - Core Generalization - Qwen-2.5 3B" (centered at the top).
* **Y-Axis (Vertical):** Labeled "Type". It contains 7 discrete categories, numbered 1 through 7 from top to bottom.
* **X-Axis (Horizontal):** Labeled "Length". It contains 20 discrete categories, numbered 0 through 19 from left to right.
* **Legend/Color Scale:** Located on the far right. It is a vertical color bar labeled "Accuracy (%)". The scale runs from 0 at the bottom to 100 at the top, with tick marks at 0, 20, 40, 60, 80, and 100. The color gradient transitions from very light blue (near white) at 0% to a deep, dark blue at 100%.
* **Data Cells:** The main body of the chart is a grid where each cell corresponds to a specific (Type, Length) pair. The cell's background color corresponds to the accuracy value, which is also printed as a number within the cell. White cells indicate missing data or a value of 0% (though the scale suggests white is 0, the absence of a number implies no data was recorded for that combination).
### Detailed Analysis
The following table reconstructs the data from the heatmap. "N/A" indicates a white cell with no numerical value.
| Type \ Length | 0 | 1 | 2 | 3 | 4 | 5 | 6 | 7 | 8 | 9 | 10 | 11 | 12 | 13 | 14 | 15 | 16 | 17 | 18 | 19 |
| :--- | :--- | :--- | :--- | :--- | :--- | :--- | :--- | :--- | :--- | :--- | :--- | :--- | :--- | :--- | :--- | :--- | :--- | :--- | :--- | :--- |
| **1** | 96.0 | 95.3 | 90.7 | 91.7 | 89.0 | 91.7 | 91.3 | 82.7 | 85.7 | 89.0 | N/A | N/A | N/A | N/A | N/A | N/A | N/A | N/A | N/A | N/A |
| **2** | N/A | 99.7 | 100.0 | 100.0 | 97.3 | 99.3 | 97.0 | 98.7 | 95.7 | 96.7 | 93.7 | N/A | N/A | N/A | N/A | N/A | N/A | N/A | N/A | N/A |
| **3** | 98.7 | 97.7 | 99.0 | 96.7 | 96.3 | 94.7 | 93.0 | 92.7 | 94.0 | 94.3 | 93.3 | 95.7 | 96.0 | 91.3 | 95.0 | 95.0 | 93.7 | 95.3 | 93.3 | 96.3 |
| **4** | N/A | 96.0 | 93.0 | 89.3 | 90.0 | 92.7 | 89.7 | 91.0 | 94.3 | 95.7 | 94.3 | 94.7 | N/A | N/A | N/A | N/A | N/A | N/A | N/A | N/A |
| **5** | N/A | N/A | N/A | N/A | N/A | N/A | N/A | 96.0 | 97.0 | 96.3 | 92.0 | 95.7 | 97.7 | 98.3 | 98.3 | 99.3 | 98.7 | 99.7 | 98.3 | 99.0 |
| **6** | 94.3 | 98.3 | 97.3 | 100.0 | 99.7 | 100.0 | 99.7 | 99.0 | 98.3 | 99.7 | 98.7 | 100.0 | 99.7 | 99.3 | 99.0 | 99.0 | 98.7 | 98.0 | 99.0 | N/A |
| **7** | 96.3 | 99.0 | 99.0 | 99.0 | 100.0 | 99.3 | 98.0 | 99.3 | 99.3 | 98.3 | 96.7 | 99.7 | 98.3 | 97.0 | N/A | N/A | N/A | N/A | N/A | N/A |
### Key Observations
1. **High Overall Performance:** The vast majority of recorded accuracy values are above 90%, with many in the high 90s and several perfect 100.0% scores. The color scale is dominated by dark blue hues.
2. **Performance by Type:**
* **Type 6** shows exceptionally high and consistent performance, with scores almost exclusively between 97.3% and 100.0% across its available lengths (0-18).
* **Type 7** also demonstrates very high performance (96.3% to 100.0%) but only for lengths 0-13.
* **Type 3** has the most complete data, spanning all lengths from 0 to 19, with scores generally in the 91-99% range.
* **Type 1** shows the lowest performance within the dataset, with a notable dip to 82.7% at Length 7.
3. **Data Sparsity Pattern:** There is a clear pattern of missing data (white cells). Types 1, 2, 4, and 7 have data only for lower lengths. Type 5 has data only for higher lengths (7-19). Only Type 3 has data across the entire length spectrum (0-19).
4. **Trend by Length:** For the types with complete or long sequences of data (e.g., Type 3, Type 6), there is no strong, consistent upward or downward trend in accuracy as "Length" increases. Performance remains relatively stable within a high band.
### Interpretation
This heatmap evaluates the "core generalization" capability of the Qwen-2.5 3B model on the MIND benchmark. The "Type" axis likely represents different categories, tasks, or problem formats within the benchmark, while "Length" probably refers to the sequence length, complexity, or number of steps in the input.
The data suggests the model has **strong generalization performance** across the tested dimensions, as evidenced by the predominantly high accuracy scores. The model appears particularly robust on "Type 6" problems. The pattern of missing data is significant; it may indicate that certain "Types" are only defined or testable for specific "Lengths," or that the evaluation was not run for all combinations. The lack of a clear performance degradation with increasing "Length" (for types where it's measured) is a positive indicator, suggesting the model's reasoning or processing does not break down significantly as problem length increases within the tested range (0-19). The outlier low score of 82.7% for Type 1 at Length 7 warrants investigation as a potential edge case or specific weakness.