## Diagram: Bayesian Network
### Overview
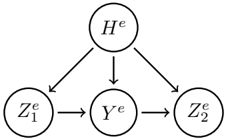
The image presents a Bayesian network diagram illustrating probabilistic relationships between variables. The diagram consists of nodes representing variables and directed edges representing dependencies.
### Components/Axes
* **Nodes:**
* H<sup>e</sup>: A node at the top of the diagram.
* Z<sub>1</sub><sup>e</sup>: A node at the bottom-left of the diagram.
* Y<sup>e</sup>: A node at the bottom-center of the diagram.
* Z<sub>2</sub><sup>e</sup>: A node at the bottom-right of the diagram.
* **Edges:**
* A directed edge from H<sup>e</sup> to Z<sub>1</sub><sup>e</sup>.
* A directed edge from H<sup>e</sup> to Y<sup>e</sup>.
* A directed edge from H<sup>e</sup> to Z<sub>2</sub><sup>e</sup>.
* A directed edge from Z<sub>1</sub><sup>e</sup> to Y<sup>e</sup>.
* A directed edge from Y<sup>e</sup> to Z<sub>2</sub><sup>e</sup>.
### Detailed Analysis
The diagram shows that H<sup>e</sup> directly influences Z<sub>1</sub><sup>e</sup>, Y<sup>e</sup>, and Z<sub>2</sub><sup>e</sup>. Additionally, Z<sub>1</sub><sup>e</sup> influences Y<sup>e</sup>, and Y<sup>e</sup> influences Z<sub>2</sub><sup>e</sup>.
### Key Observations
The network structure indicates that H<sup>e</sup> is a common cause for Z<sub>1</sub><sup>e</sup>, Y<sup>e</sup>, and Z<sub>2</sub><sup>e</sup>. Z<sub>1</sub><sup>e</sup> and Y<sup>e</sup> are also causally related, with Z<sub>1</sub><sup>e</sup> influencing Y<sup>e</sup>, and Y<sup>e</sup> influencing Z<sub>2</sub><sup>e</sup>.
### Interpretation
The Bayesian network represents a probabilistic model where the value of H<sup>e</sup> affects the probabilities of Z<sub>1</sub><sup>e</sup>, Y<sup>e</sup>, and Z<sub>2</sub><sup>e</sup>. The dependencies between Z<sub>1</sub><sup>e</sup>, Y<sup>e</sup>, and Z<sub>2</sub><sup>e</sup> suggest a sequential relationship, where Z<sub>1</sub><sup>e</sup> influences Y<sup>e</sup>, which in turn influences Z<sub>2</sub><sup>e</sup>. This type of network is used to model causal relationships and perform probabilistic inference.