\n
## Diagram: Decay Scheme
### Overview
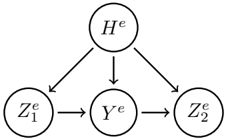
The image depicts a diagram representing a decay scheme, likely in the context of nuclear physics or particle physics. It shows a parent nucleus (H<sup>e</sup>) decaying into a series of daughter nuclei (Z<sub>1</sub><sup>e</sup>, Y<sup>e</sup>, and Z<sub>2</sub><sup>e</sup>). Arrows indicate the direction of the decay process.
### Components/Axes
The diagram consists of four circular nodes representing nuclei, labeled as follows:
* **H<sup>e</sup>**: Located at the top-center of the diagram.
* **Z<sub>1</sub><sup>e</sup>**: Located at the bottom-left of the diagram.
* **Y<sup>e</sup>**: Located at the center-bottom of the diagram.
* **Z<sub>2</sub><sup>e</sup>**: Located at the bottom-right of the diagram.
Arrows connect the nodes, indicating the decay pathways. The superscript 'e' appears to be a notation related to the charge or energy state of the particles.
### Detailed Analysis or Content Details
The diagram shows the following decay sequence:
1. **H<sup>e</sup> → Z<sub>1</sub><sup>e</sup>**: An arrow points from H<sup>e</sup> to Z<sub>1</sub><sup>e</sup>, indicating a decay pathway.
2. **H<sup>e</sup> → Y<sup>e</sup>**: An arrow points from H<sup>e</sup> to Y<sup>e</sup>, indicating a decay pathway.
3. **Z<sub>1</sub><sup>e</sup> → Y<sup>e</sup>**: An arrow points from Z<sub>1</sub><sup>e</sup> to Y<sup>e</sup>, indicating a decay pathway.
4. **Y<sup>e</sup> → Z<sub>2</sub><sup>e</sup>**: An arrow points from Y<sup>e</sup> to Z<sub>2</sub><sup>e</sup>, indicating a decay pathway.
The diagram does not provide any quantitative data such as decay rates, energies, or half-lives. It only illustrates the possible decay pathways.
### Key Observations
The decay scheme suggests a cascade decay process. H<sup>e</sup> can decay directly into either Z<sub>1</sub><sup>e</sup> or Y<sup>e</sup>. Z<sub>1</sub><sup>e</sup> can then decay into Y<sup>e</sup>, and Y<sup>e</sup> subsequently decays into Z<sub>2</sub><sup>e</sup>. This indicates a multi-step decay process.
### Interpretation
This diagram likely represents a simplified decay scheme for a specific isotope or excited state of a nucleus. The 'e' superscript could denote an electron emission or capture process, or it could be a notation for the energy level of the nucleus. The diagram illustrates the possible decay routes and the relationships between the parent and daughter nuclei. Without additional information, it is difficult to determine the specific isotope or the nature of the decay processes involved. The diagram is a qualitative representation of the decay process, focusing on the sequence of decays rather than the quantitative aspects. It suggests that the decay of H<sup>e</sup> is not a single-step process but involves a series of intermediate states and decays.