## Chart/Diagram Type: Quadratic Function Identification
### Overview
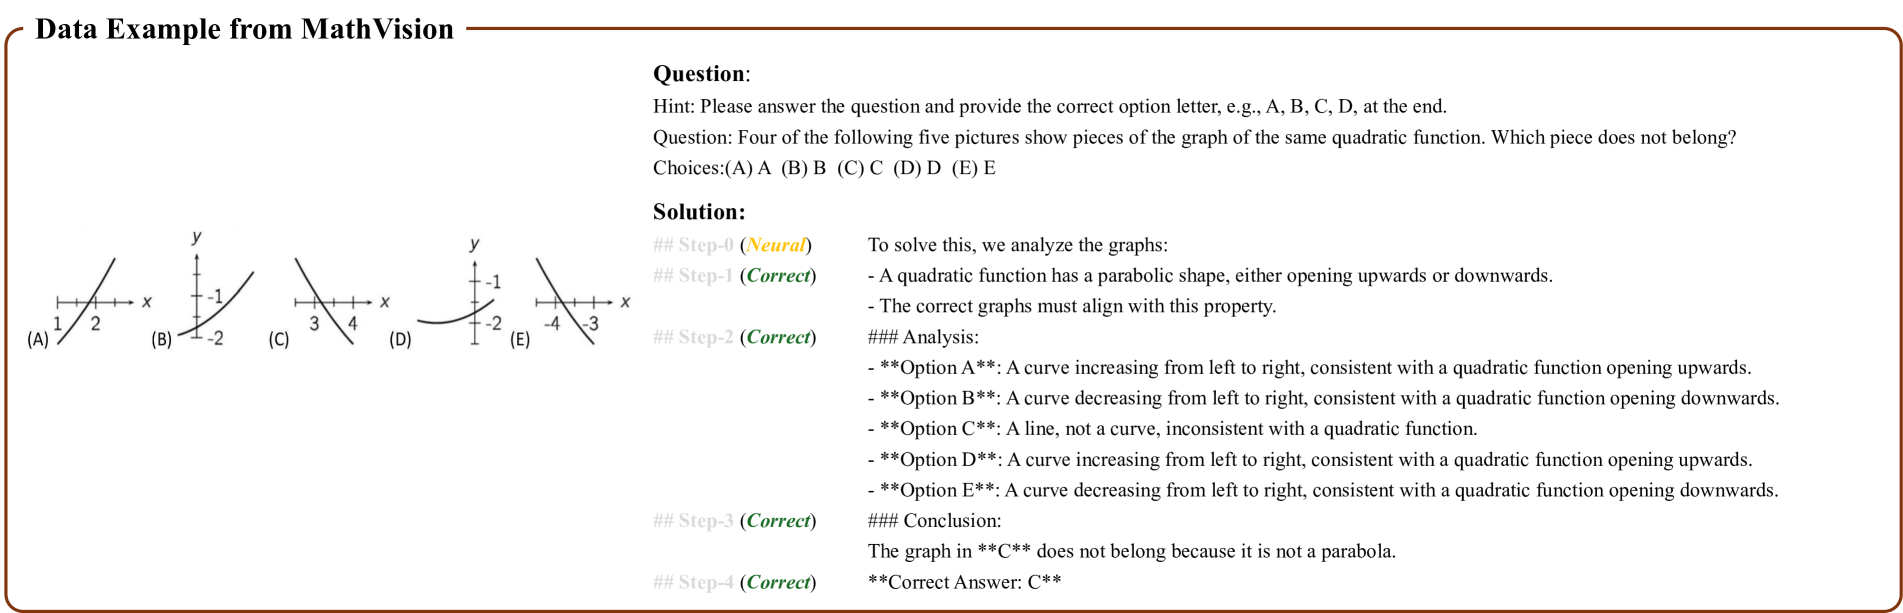
The image presents a multiple-choice question related to quadratic functions. It asks the user to identify which of five provided graphs does not belong with the others, as the other four represent pieces of the same quadratic function. The image includes the question, possible answers (A through E), and a detailed solution explaining the reasoning behind the correct answer.
### Components/Axes
* **Title:** "Data Example from MathVision"
* **Question:** Asks which of the five graphs does not belong with the others, as the other four represent pieces of the same quadratic function.
* **Choices:** (A) A, (B) B, (C) C, (D) D, (E) E
* **Graphs:** Five separate coordinate plane graphs labeled (A) through (E). Each graph displays a different line or curve.
* **Axes:** Each graph has an x-axis and a y-axis.
* **Graph A:** x-axis marked at 1 and 2.
* **Graph B:** y-axis marked at -2 and -1.
* **Graph C:** x-axis marked at 3 and 4.
* **Graph D:** y-axis marked at -2 and -1.
* **Graph E:** x-axis marked at -4 and -3.
* **Solution:** Provides a step-by-step explanation of how to solve the problem.
* **Step-0:** (Neural)
* **Step-1:** (Correct)
* **Step-2:** (Correct)
* **Step-3:** (Correct)
* **Step-4:** (Correct)
* **Analysis:** Describes each option (A-E) and its consistency with a quadratic function.
* **Conclusion:** States that graph C does not belong because it is not a parabola.
* **Correct Answer:** C
### Detailed Analysis or ### Content Details
* **Graph A:** A straight line with a positive slope.
* **Graph B:** A curve opening downwards.
* **Graph C:** A straight line with a negative slope.
* **Graph D:** A curve opening upwards.
* **Graph E:** A curve opening downwards.
The solution explains that quadratic functions have a parabolic shape (either opening upwards or downwards). It then analyzes each option:
* **Option A:** A curve increasing from left to right, consistent with a quadratic function opening upwards.
* **Option B:** A curve decreasing from left to right, consistent with a quadratic function opening downwards.
* **Option C:** A line, not a curve, inconsistent with a quadratic function.
* **Option D:** A curve increasing from left to right, consistent with a quadratic function opening upwards.
* **Option E:** A curve decreasing from left to right, consistent with a quadratic function opening downwards.
### Key Observations
* Graph C is the only graph that is a straight line, while the others are curves.
* The solution correctly identifies that a straight line is not a parabola.
### Interpretation
The image is a problem-solving exercise designed to test the understanding of quadratic functions and their graphical representation. The key takeaway is that quadratic functions are represented by parabolas, and any graph that is not a parabola (like a straight line) cannot be part of the same quadratic function. The solution clearly explains the reasoning, making it a useful educational tool.