## Diagram: Task Solving Process
### Overview
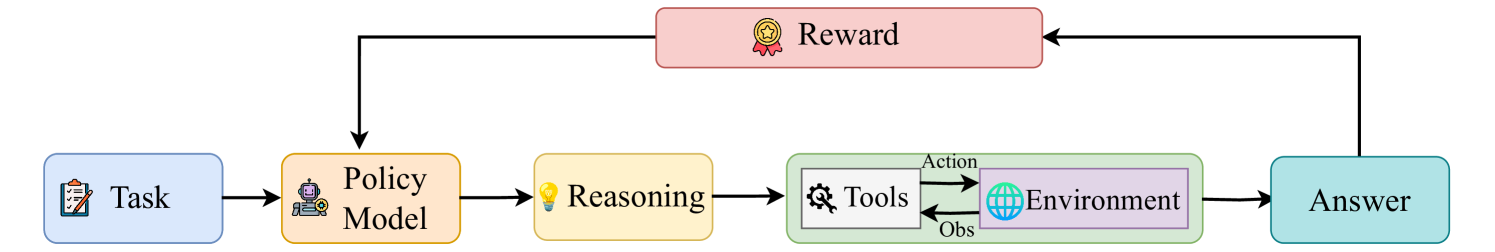
The image is a diagram illustrating a task-solving process, likely within the context of artificial intelligence or machine learning. It shows a sequence of steps, starting from a "Task" and leading to an "Answer," with feedback loops and intermediate stages like "Policy Model," "Reasoning," "Tools," "Environment," and "Reward."
### Components/Axes
* **Task:** A blue rounded rectangle containing an icon of a clipboard with a checklist.
* **Policy Model:** An orange rounded rectangle containing an icon of a robot with a gear.
* **Reasoning:** A yellow rounded rectangle containing an icon of a lightbulb.
* **Tools:** A green rounded rectangle containing an icon of a gear. The label "Action" is above the arrow pointing from "Tools" to "Environment," and the label "Obs" is below the arrow pointing from "Environment" to "Tools."
* **Environment:** A light purple rounded rectangle containing an icon of a globe.
* **Answer:** A teal rounded rectangle.
* **Reward:** A pink rounded rectangle containing an icon of a medal.
* **Arrows:** Black arrows indicate the flow of information and control between the components.
### Detailed Analysis or ### Content Details
The diagram depicts the following flow:
1. **Task** (blue) -> **Policy Model** (orange): The process begins with a task being fed into a policy model.
2. **Policy Model** (orange) -> **Reasoning** (yellow): The policy model then informs the reasoning stage.
3. **Reasoning** (yellow) -> **Tools** (green) and **Environment** (purple): The reasoning stage interacts with both the tools and the environment.
4. **Tools** (green) <-> **Environment** (purple): The tools and environment interact with each other, with "Action" going from Tools to Environment and "Obs" (Observation) going from Environment to Tools.
5. **Environment** (purple) -> **Answer** (teal): The environment leads to an answer.
6. **Answer** (teal) -> **Reward** (pink): The answer is evaluated, resulting in a reward.
7. **Reward** (pink) -> **Policy Model** (orange): The reward signal is fed back into the policy model, likely for learning and improvement.
8. **Reward** (pink) -> **Task** (blue): The reward signal is fed back into the task, likely for learning and improvement.
### Key Observations
* The diagram highlights a cyclical process, with feedback loops from the "Reward" stage influencing both the "Policy Model" and the "Task."
* The "Tools" and "Environment" components are closely coupled, suggesting an iterative interaction.
* The "Action" and "Obs" labels indicate the flow of actions from tools to the environment and observations from the environment back to the tools.
### Interpretation
The diagram illustrates a reinforcement learning or decision-making process. A "Task" is given to a "Policy Model," which uses "Reasoning" to interact with "Tools" in an "Environment." The "Environment" provides observations back to the "Tools," allowing for iterative adjustments. The final "Answer" is evaluated, and a "Reward" signal is generated. This reward is then used to update the "Policy Model," improving its ability to solve similar tasks in the future. The feedback loop from "Reward" to "Task" suggests that the task itself might be evolving based on the agent's performance.