## Violin Plot: US Foreign Policy
### Overview
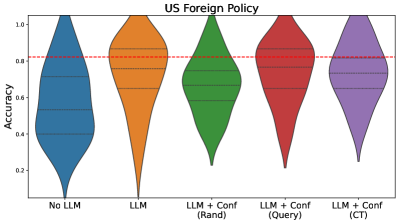
The image is a violin plot comparing the accuracy of different models for US Foreign Policy analysis. The models include a baseline "No LLM" model, an "LLM" model, and three variations of "LLM + Conf" models: "(Rand)", "(Query)", and "(CT)". The plot shows the distribution of accuracy scores for each model. A red dashed line indicates a reference accuracy level.
### Components/Axes
* **Title:** US Foreign Policy
* **Y-axis:** Accuracy, ranging from 0.0 to 1.0 in increments of 0.2.
* **X-axis:** Categorical, representing different models:
* No LLM (Blue)
* LLM (Orange)
* LLM + Conf (Rand) (Green)
* LLM + Conf (Query) (Red)
* LLM + Conf (CT) (Purple)
* **Horizontal Red Dashed Line:** Located at approximately 0.82 accuracy.
* **Violin Plot Elements:** Each violin plot shows the distribution of accuracy scores for the corresponding model. Horizontal dashed lines within each violin indicate quartiles.
### Detailed Analysis
* **No LLM (Blue):** The distribution is relatively wide, suggesting a range of accuracy scores. The median appears to be around 0.55.
* **LLM (Orange):** The distribution is narrower and shifted upwards compared to "No LLM," with the median around 0.85.
* **LLM + Conf (Rand) (Green):** The distribution is similar to "LLM," with a median around 0.78.
* **LLM + Conf (Query) (Red):** The distribution is slightly higher than "LLM," with a median around 0.88.
* **LLM + Conf (CT) (Purple):** The distribution is similar to "LLM + Conf (Rand)", with a median around 0.75.
### Key Observations
* The "LLM" model and its variations generally outperform the "No LLM" baseline.
* The "LLM + Conf (Query)" model appears to have the highest median accuracy.
* The "No LLM" model has the widest distribution, indicating the highest variability in accuracy.
### Interpretation
The violin plot suggests that incorporating a Large Language Model (LLM) improves the accuracy of US Foreign Policy analysis compared to not using an LLM. Adding a confidence measure to the LLM ("LLM + Conf") has varying effects depending on the method used to determine confidence. Using a query-based confidence measure ("LLM + Conf (Query)") appears to yield the best results, while random and CT confidence measures are less effective. The red dashed line at 0.82 provides a benchmark, and it's clear that the LLM models generally perform around or above this level. The "No LLM" model's wide distribution indicates that its performance is less consistent.