## Violin Plot: US Foreign Policy Accuracy Comparison
### Overview
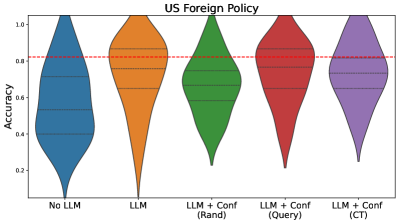
The image is a violin plot comparing the accuracy distributions of five different models or conditions related to "US Foreign Policy." The chart displays the probability density of accuracy scores for each category, with a horizontal reference line indicating a benchmark accuracy of 0.8.
### Components/Axes
* **Chart Title:** "US Foreign Policy" (centered at the top).
* **Y-Axis:**
* **Label:** "Accuracy" (rotated vertically on the left side).
* **Scale:** Linear scale ranging from 0.0 to 1.0, with major tick marks at 0.0, 0.2, 0.4, 0.6, 0.8, and 1.0.
* **X-Axis:** Displays five categorical groups. From left to right:
1. "No LLM"
2. "LLM"
3. "LLM + Conf (Rand)"
4. "LLM + Conf (Query)"
5. "LLM + Conf (CT)"
* **Reference Line:** A horizontal red dashed line is drawn across the entire plot at the y-axis value of 0.8.
* **Legend/Color Mapping:** Each category is represented by a distinct colored violin plot. The mapping is positional (left to right) and color-coded:
* "No LLM": Blue
* "LLM": Orange
* "LLM + Conf (Rand)": Green
* "LLM + Conf (Query)": Red
* "LLM + Conf (CT)": Purple
### Detailed Analysis
Each violin plot shows the distribution of accuracy scores. The wider the violin at a given y-value, the more data points are concentrated around that accuracy. Internal horizontal lines likely represent quartiles (median and interquartile range).
1. **No LLM (Blue, far left):**
* **Trend/Shape:** The distribution is broad and relatively symmetric, peaking around the median. It has a wide base, indicating a significant number of lower accuracy scores.
* **Key Values (Approximate):**
* Median (central line): ~0.55
* Interquartile Range (IQR): Spans roughly from 0.40 to 0.70.
* Full Range: Extends from near 0.0 to just below 1.0.
2. **LLM (Orange, second from left):**
* **Trend/Shape:** This distribution is highly skewed. It has a very long, thin tail extending down to near 0.0, but the bulk of the data (the widest part) is concentrated at a higher accuracy level.
* **Key Values (Approximate):**
* Median: ~0.75 (visibly higher than "No LLM").
* IQR: Concentrated between ~0.65 and ~0.85.
* Full Range: From ~0.0 to ~0.95.
3. **LLM + Conf (Rand) (Green, center):**
* **Trend/Shape:** This distribution is more compact and centered higher than the first two. It is somewhat bimodal or has a flattened top, with the widest section just below the 0.8 reference line.
* **Key Values (Approximate):**
* Median: ~0.78.
* IQR: Spans from ~0.70 to ~0.85.
* Full Range: From ~0.30 to ~0.95.
4. **LLM + Conf (Query) (Red, second from right):**
* **Trend/Shape:** This is the most concentrated and highest-performing distribution. It is narrow and tall, with the vast majority of its mass above the 0.8 reference line.
* **Key Values (Approximate):**
* Median: ~0.85 (the highest median of all groups).
* IQR: Very tight, roughly from 0.80 to 0.90.
* Full Range: From ~0.60 to ~0.98.
5. **LLM + Conf (CT) (Purple, far right):**
* **Trend/Shape:** Similar in shape to the "LLM + Conf (Rand)" plot but appears slightly more concentrated around its median. The bulk of the data is also centered near the 0.8 line.
* **Key Values (Approximate):**
* Median: ~0.80 (right on the reference line).
* IQR: From ~0.72 to ~0.86.
* Full Range: From ~0.25 to ~0.95.
### Key Observations
* **Performance Hierarchy:** There is a clear progression in median accuracy from left to right: "No LLM" < "LLM" < "LLM + Conf (Rand)" ≈ "LLM + Conf (CT)" < "LLM + Conf (Query)".
* **Impact of Confidence Methods:** All three "LLM + Conf" methods show higher median accuracy and less downward spread (fewer very low scores) compared to the base "LLM" model.
* **Benchmark Comparison:** The "LLM + Conf (Query)" model is the only one where the median and the majority of the distribution lie clearly above the 0.8 accuracy benchmark. The "LLM + Conf (Rand)" and "LLM + Conf (CT)" models have medians very close to this line.
* **Variability:** The "LLM" model shows the greatest variability, with an extremely long tail towards low accuracy. The "LLM + Conf (Query)" model shows the least variability, indicating more consistent performance.
### Interpretation
The data suggests that augmenting a Large Language Model (LLM) with some form of confidence scoring ("Conf") significantly improves its accuracy and reliability on the task of US Foreign Policy analysis. The base "LLM" alone, while better than having "No LLM," is highly inconsistent, as evidenced by its long tail of poor performance.
Among the confidence methods, the "Query" variant appears most effective, yielding the highest and most consistent accuracy. The "Rand" (likely random) and "CT" (method unspecified) confidence methods also provide substantial benefits over the base LLM, bringing median performance to the benchmark level of 0.8. This implies that the mechanism for estimating or applying confidence is crucial, with structured querying being superior to random or other (CT) approaches in this context. The chart effectively argues for the value of confidence-aware mechanisms in deploying LLMs for sensitive or knowledge-intensive domains like foreign policy.