## Violin Plot: US Foreign Policy Accuracy Comparison
### Overview
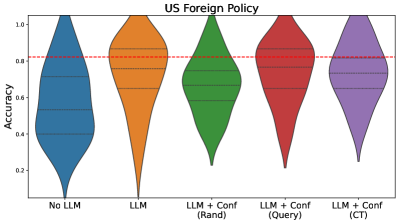
The image is a violin plot comparing the accuracy distributions of different configurations of a US Foreign Policy model. The x-axis represents five model configurations, while the y-axis shows accuracy values ranging from 0 to 1. A red dashed line at 0.8 serves as a reference threshold.
### Components/Axes
- **X-axis (Categories)**:
- No LLM (blue)
- LLM (orange)
- LLM + Conf (Rand) (green)
- LLM + Conf (Query) (red)
- LLM + Conf (CT) (purple)
- **Y-axis (Accuracy)**: Labeled "Accuracy" with a scale from 0 to 1.
- **Legend**: Implicitly defined by color coding (no explicit legend box).
- **Reference Line**: Red dashed line at 0.8 accuracy.
### Detailed Analysis
1. **No LLM (Blue)**:
- Distribution spans 0.2–0.6, with a median ~0.4.
- Narrowest distribution, indicating low variability.
2. **LLM (Orange)**:
- Distribution spans 0.4–0.8, with a median ~0.65.
- Wider spread than No LLM, suggesting increased variability.
3. **LLM + Conf (Rand) (Green)**:
- Distribution spans 0.5–0.75, with a median ~0.65.
- Similar median to LLM but slightly narrower spread.
4. **LLM + Conf (Query) (Red)**:
- Distribution spans 0.6–0.85, with a median ~0.75.
- Highest median among non-CT configurations, with moderate spread.
5. **LLM + Conf (CT) (Purple)**:
- Distribution spans 0.7–0.9, with a median ~0.82.
- Tightest distribution around the 0.8 threshold, indicating consistent high performance.
### Key Observations
- **CT Configuration (Purple)**:
- Median accuracy (~0.82) exceeds the 0.8 reference line.
- Narrowest distribution, suggesting stable performance.
- **Query Configuration (Red)**:
- Second-highest median (~0.75) but still below the 0.8 threshold.
- **No LLM (Blue)**:
- Lowest median (~0.4) and narrowest distribution, indicating poor performance.
- **Rand Configuration (Green)**:
- Similar median to LLM but slightly better spread.
### Interpretation
The data demonstrates that the **LLM + Conf (CT)** configuration achieves the highest and most consistent accuracy, surpassing the 0.8 benchmark. This suggests that the CT (likely "Contextual Tuning" or similar) enhancement is critical for optimal performance. The **LLM + Conf (Query)** configuration shows promise but falls short of the target. The **No LLM** baseline performs poorly, highlighting the necessity of language model integration. The **Rand** configuration offers minimal improvement over the base LLM, indicating that random confidence adjustments may not be effective. The red dashed line at 0.8 acts as a performance threshold, with only the CT configuration meeting or exceeding it. This analysis underscores the importance of targeted confidence adjustments (e.g., CT) in improving model reliability for US Foreign Policy tasks.