## Bar Chart: F1 Scores for Different Similarity Measures on Three Datasets
### Overview
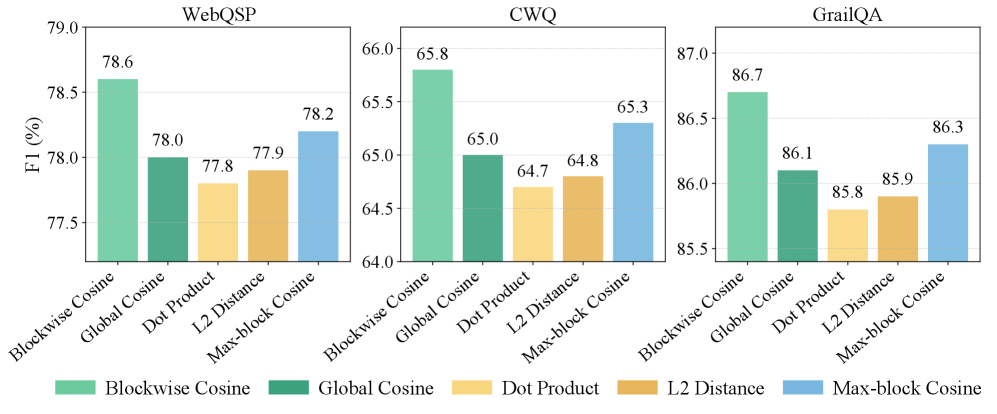
The image presents three bar charts side-by-side, each displaying the F1 scores of different similarity measures (Blockwise Cosine, Global Cosine, Dot Product, L2 Distance, Max-block Cosine) on a different dataset (WebQSP, CWQ, GrailQA). The y-axis represents F1 score in percentage, and the x-axis represents the different similarity measures.
### Components/Axes
* **Titles:**
* Top-left: WebQSP
* Top-center: CWQ
* Top-right: GrailQA
* **Y-axis:**
* Label: F1 (%)
* Scale: 64.0 to 79.0 for WebQSP, 64.0 to 66.0 for CWQ, 85.5 to 87.0 for GrailQA, with increments of 0.5.
* **X-axis:**
* Labels (Similarity Measures): Blockwise Cosine, Global Cosine, Dot Product, L2 Distance, Max-block Cosine.
* **Legend:** Located at the bottom of the image.
* Blockwise Cosine: Light Green
* Global Cosine: Dark Green
* Dot Product: Light Yellow
* L2 Distance: Dark Yellow
* Max-block Cosine: Light Blue
### Detailed Analysis
**WebQSP Dataset (Left Chart):**
* **Blockwise Cosine (Light Green):** F1 score of approximately 78.6%.
* **Global Cosine (Dark Green):** F1 score of approximately 78.0%.
* **Dot Product (Light Yellow):** F1 score of approximately 77.8%.
* **L2 Distance (Dark Yellow):** F1 score of approximately 77.9%.
* **Max-block Cosine (Light Blue):** F1 score of approximately 78.2%.
**CWQ Dataset (Center Chart):**
* **Blockwise Cosine (Light Green):** F1 score of approximately 65.8%.
* **Global Cosine (Dark Green):** F1 score of approximately 65.0%.
* **Dot Product (Light Yellow):** F1 score of approximately 64.7%.
* **L2 Distance (Dark Yellow):** F1 score of approximately 64.8%.
* **Max-block Cosine (Light Blue):** F1 score of approximately 65.3%.
**GrailQA Dataset (Right Chart):**
* **Blockwise Cosine (Light Green):** F1 score of approximately 86.7%.
* **Global Cosine (Dark Green):** F1 score of approximately 86.1%.
* **Dot Product (Light Yellow):** F1 score of approximately 85.8%.
* **L2 Distance (Dark Yellow):** F1 score of approximately 85.9%.
* **Max-block Cosine (Light Blue):** F1 score of approximately 86.3%.
### Key Observations
* Across all three datasets, Blockwise Cosine generally achieves the highest F1 score.
* Dot Product and L2 Distance consistently show lower F1 scores compared to Blockwise Cosine, Global Cosine, and Max-block Cosine.
* The F1 scores vary significantly across the datasets, with GrailQA showing the highest scores and CWQ showing the lowest.
### Interpretation
The bar charts compare the performance of different similarity measures on three question-answering datasets. The F1 score, a measure of accuracy, is used to evaluate the effectiveness of each similarity measure. The results suggest that Blockwise Cosine is a strong performer across all datasets, while Dot Product and L2 Distance tend to underperform. The differences in F1 scores across datasets indicate that the choice of similarity measure can be dataset-dependent. The GrailQA dataset appears to be easier or more suited to these similarity measures, resulting in higher F1 scores compared to WebQSP and CWQ.