# Technical Document Extraction
## Header
- **Equation**:
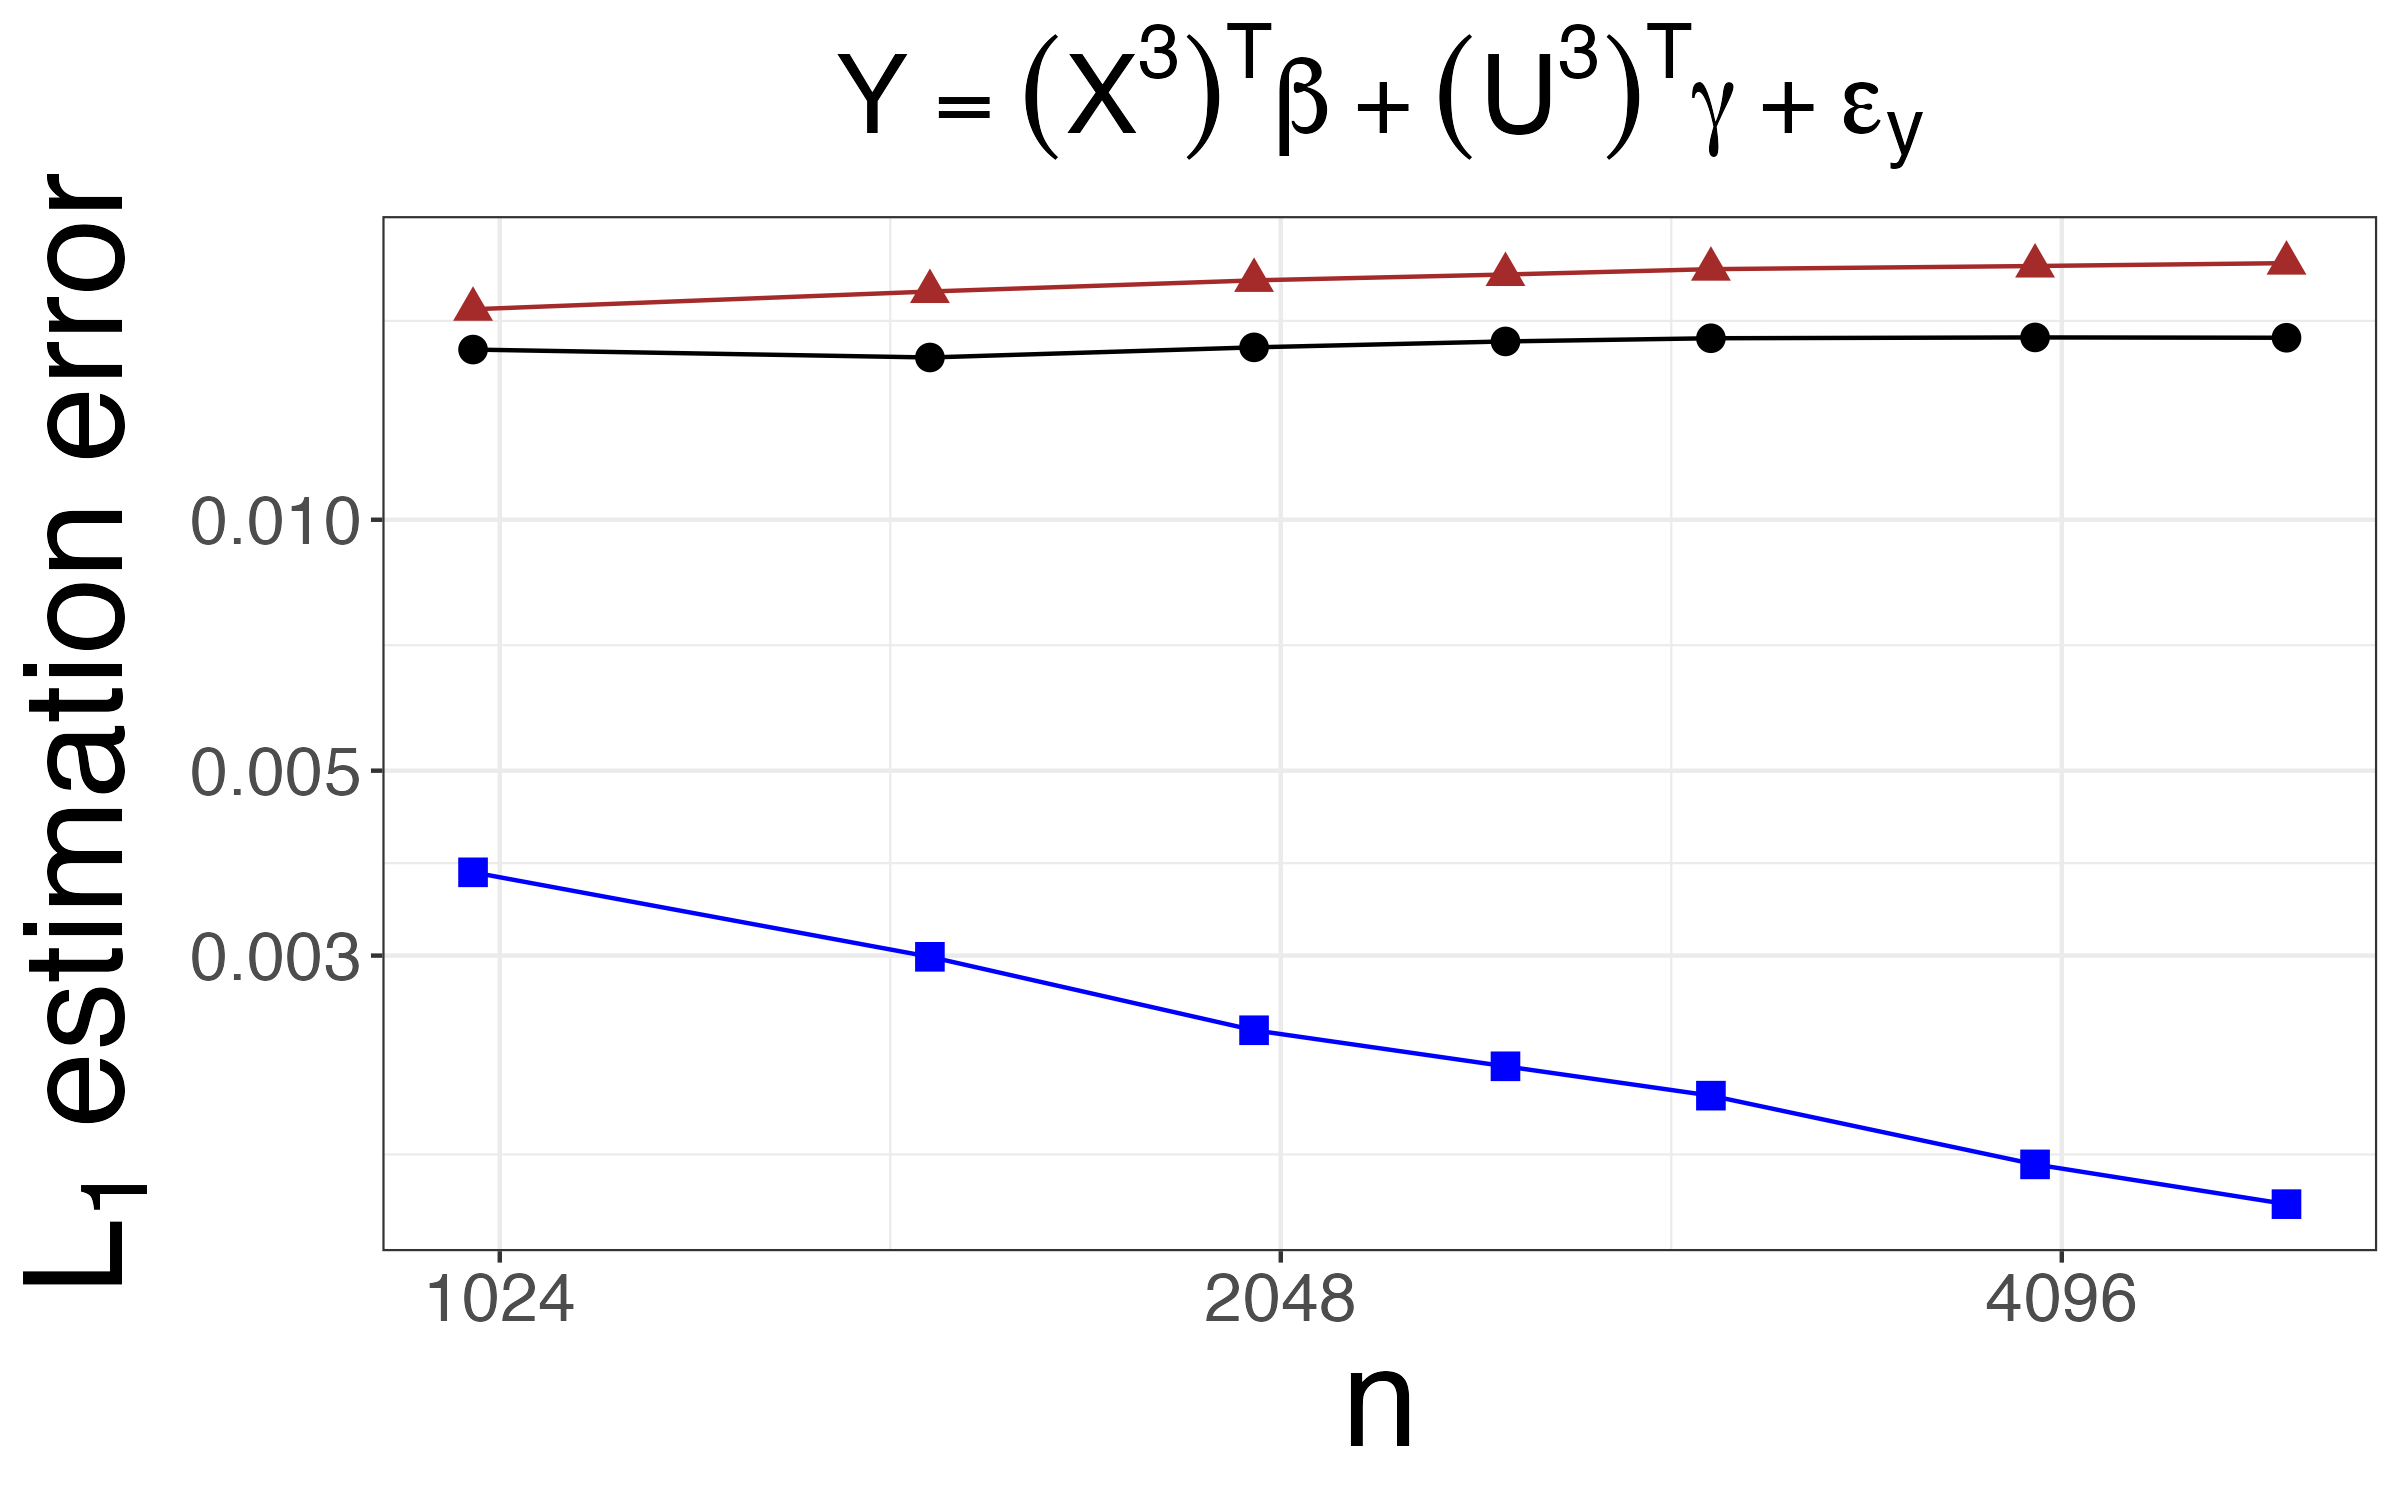
`Y = (X³)ᵀβ + (U³)ᵀγ + εγ`
(Text rendered in black font at the top of the image)
## Main Chart
### Axes
- **X-axis**:
- Label: `n` (black font)
- Tick marks: `1024`, `2048`, `4096`
- **Y-axis**:
- Label: `L₁ estimation error` (black font)
- Tick marks: `0.005`, `0.010`, `0.015`
### Legend
- **Placement**: Top-right corner (implied by standard chart conventions)
- **Components**:
1. **Red triangles**: `(X³)ᵀβ`
2. **Black circles**: `(U³)ᵀγ`
3. **Blue squares**: `εγ`
### Data Trends
1. **Red line (triangles)**:
- **Trend**: Slightly increasing (flatline with minor upward slope)
- **Values**:
- At `n = 1024`: ~0.012
- At `n = 2048`: ~0.0125
- At `n = 4096`: ~0.013
2. **Black line (circles)**:
- **Trend**: Flat (constant)
- **Values**:
- At `n = 1024`: ~0.011
- At `n = 2048`: ~0.011
- At `n = 4096`: ~0.011
3. **Blue line (squares)**:
- **Trend**: Decreasing (linear decline)
- **Values**:
- At `n = 1024`: ~0.0035
- At `n = 2048`: ~0.0025
- At `n = 4096`: ~0.001
## Footer
- **No additional text or components**
## Validation
- **Legend-Data Consistency**:
- Red triangles match `(X³)ᵀβ` (topmost line).
- Black circles match `(U³)ᵀγ` (middle line).
- Blue squares match `εγ` (bottom line).
- **Spatial Grounding**:
- All labels and markers align with standard Cartesian chart conventions.
- **Trend Verification**:
- Red line’s upward slope and blue line’s decline are visually confirmed.
## Notes
- **Language**: All text is in English.
- **No omitted data**: All axis labels, legends, and trends are explicitly extracted.