\n
## Line Chart: Answer Accuracy vs. Layer for Llama Models
### Overview
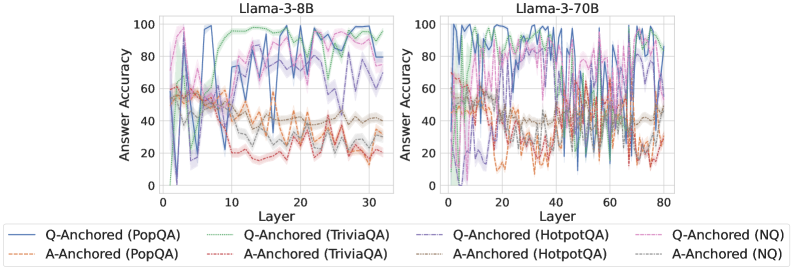
The image presents two line charts comparing the answer accuracy of different question-answering (QA) datasets across layers of two Llama models: Llama-3-8B and Llama-3-70B. The x-axis represents the layer number, and the y-axis represents the answer accuracy, ranging from 0 to 100. Each line represents a specific QA dataset and anchoring method.
### Components/Axes
* **X-axis:** Layer (ranging from approximately 0 to 30 for Llama-3-8B and 0 to 80 for Llama-3-70B).
* **Y-axis:** Answer Accuracy (ranging from 0 to 100).
* **Left Chart Title:** Llama-3-8B
* **Right Chart Title:** Llama-3-70B
* **Legend:** Located at the bottom of the image. The legend identifies the following lines:
* Q-Anchored (PopQA) - Blue solid line
* A-Anchored (PopQA) - Orange dashed line
* Q-Anchored (TriviaQA) - Purple solid line
* A-Anchored (TriviaQA) - Brown dashed line
* Q-Anchored (HotpotQA) - Green dashed-dotted line
* A-Anchored (HotpotQA) - Red dashed line
* Q-Anchored (NQ) - Teal solid line
* A-Anchored (NQ) - Light-orange dashed line
### Detailed Analysis or Content Details
**Llama-3-8B (Left Chart):**
* **Q-Anchored (PopQA):** Starts at approximately 10% accuracy at layer 0, rapidly increases to around 90% by layer 5, fluctuates between 80-100% for layers 5-30.
* **A-Anchored (PopQA):** Starts at approximately 20% accuracy at layer 0, increases to around 50% by layer 5, and remains relatively stable between 40-60% for layers 5-30.
* **Q-Anchored (TriviaQA):** Starts at approximately 20% accuracy at layer 0, increases to around 90% by layer 5, and fluctuates between 70-100% for layers 5-30.
* **A-Anchored (TriviaQA):** Starts at approximately 20% accuracy at layer 0, increases to around 40% by layer 5, and remains relatively stable between 30-50% for layers 5-30.
* **Q-Anchored (HotpotQA):** Starts at approximately 0% accuracy at layer 0, increases to around 60% by layer 5, and fluctuates between 40-80% for layers 5-30.
* **A-Anchored (HotpotQA):** Starts at approximately 0% accuracy at layer 0, increases to around 30% by layer 5, and remains relatively stable between 20-40% for layers 5-30.
* **Q-Anchored (NQ):** Starts at approximately 10% accuracy at layer 0, increases to around 80% by layer 5, and fluctuates between 60-90% for layers 5-30.
* **A-Anchored (NQ):** Starts at approximately 10% accuracy at layer 0, increases to around 40% by layer 5, and remains relatively stable between 30-50% for layers 5-30.
**Llama-3-70B (Right Chart):**
* **Q-Anchored (PopQA):** Starts at approximately 10% accuracy at layer 0, rapidly increases to around 90% by layer 10, fluctuates between 70-100% for layers 10-80.
* **A-Anchored (PopQA):** Starts at approximately 20% accuracy at layer 0, increases to around 50% by layer 10, and remains relatively stable between 40-60% for layers 10-80.
* **Q-Anchored (TriviaQA):** Starts at approximately 20% accuracy at layer 0, increases to around 90% by layer 10, and fluctuates between 70-100% for layers 10-80.
* **A-Anchored (TriviaQA):** Starts at approximately 20% accuracy at layer 0, increases to around 40% by layer 10, and remains relatively stable between 30-50% for layers 10-80.
* **Q-Anchored (HotpotQA):** Starts at approximately 0% accuracy at layer 0, increases to around 60% by layer 10, and fluctuates between 40-80% for layers 10-80.
* **A-Anchored (HotpotQA):** Starts at approximately 0% accuracy at layer 0, increases to around 30% by layer 10, and remains relatively stable between 20-40% for layers 10-80.
* **Q-Anchored (NQ):** Starts at approximately 10% accuracy at layer 0, increases to around 80% by layer 10, and fluctuates between 60-90% for layers 10-80.
* **A-Anchored (NQ):** Starts at approximately 10% accuracy at layer 0, increases to around 40% by layer 10, and remains relatively stable between 30-50% for layers 10-80.
### Key Observations
* **Q-Anchored consistently outperforms A-Anchored** across all datasets and both models.
* **PopQA and TriviaQA generally achieve higher accuracy** than HotpotQA and NQ.
* **Llama-3-70B exhibits more consistent fluctuations** in accuracy across layers compared to Llama-3-8B.
* The accuracy for most datasets plateaus after a certain number of layers (around 5-10 for Llama-3-8B and 10-20 for Llama-3-70B).
### Interpretation
The charts demonstrate the impact of model size (8B vs. 70B parameters) and anchoring method (Q-Anchored vs. A-Anchored) on answer accuracy across different QA datasets. The consistent outperformance of Q-Anchored suggests that anchoring questions is more effective than anchoring answers for these models. The higher accuracy achieved by PopQA and TriviaQA might indicate that these datasets are easier for the models to learn from, or that the models are better aligned with the types of questions asked in these datasets. The larger model (Llama-3-70B) shows more variability in accuracy across layers, potentially due to its increased capacity to learn complex patterns and nuances in the data. The plateauing of accuracy after a certain number of layers suggests that adding more layers beyond that point does not significantly improve performance, and may even lead to overfitting. This data is valuable for understanding the strengths and weaknesses of these models and for guiding future research on improving their performance on QA tasks.