TECHNICAL ASSET FINGERPRINT
b9efd2cda641dc4800ecaada
Click to view fullscreen
Press ESC or click to close
FOUND IN PAPERS
EXPERT: healer-alpha-free VERSION 1
RUNTIME: free/openrouter/healer-alpha
INTEL_VERIFIED
## Line Charts: Llama-3 Model Layer-wise Answer Accuracy
### Overview
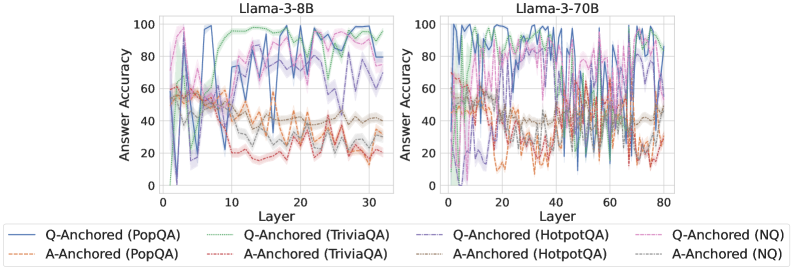
The image displays two side-by-side line charts comparing the "Answer Accuracy" of two Large Language Models (Llama-3-8B and Llama-3-70B) across their internal layers. The analysis evaluates performance using two different prompting methods ("Q-Anchored" and "A-Anchored") across four distinct question-answering datasets. The charts are dense and noisy, showing significant fluctuation in accuracy from layer to layer.
### Components/Axes
* **Chart Titles:**
* Left Chart: `Llama-3-8B`
* Right Chart: `Llama-3-70B`
* **X-Axis (Both Charts):** Label is `Layer`. Represents the sequential layer index within the model.
* Llama-3-8B scale: 0 to 30, with major ticks at 0, 10, 20, 30.
* Llama-3-70B scale: 0 to 80, with major ticks at 0, 20, 40, 60, 80.
* **Y-Axis (Both Charts):** Label is `Answer Accuracy`. Represents a percentage score.
* Scale: 0 to 100, with major ticks at 0, 20, 40, 60, 80, 100.
* **Legend (Bottom of Image, spanning both charts):** Contains 8 series, differentiated by color and line style (solid vs. dashed).
* **Solid Lines (Q-Anchored):**
* Blue: `Q-Anchored (PopQA)`
* Green: `Q-Anchored (TriviaQA)`
* Purple: `Q-Anchored (HotpotQA)`
* Pink: `Q-Anchored (NQ)`
* **Dashed Lines (A-Anchored):**
* Orange: `A-Anchored (PopQA)`
* Red: `A-Anchored (TriviaQA)`
* Gray: `A-Anchored (HotpotQA)`
* Light Blue: `A-Anchored (NQ)`
### Detailed Analysis
**Llama-3-8B Chart (Left):**
* **General Trend:** All lines exhibit high variance, with sharp peaks and troughs from one layer to the next. There is no smooth, monotonic trend for any series.
* **Q-Anchored Series (Solid Lines):** Generally achieve higher peak accuracy than their A-Anchored counterparts. The blue (PopQA) and green (TriviaQA) lines frequently reach the highest accuracy values, often peaking between 80-100% in the mid-to-late layers (layers 10-30). The purple (HotpotQA) and pink (NQ) lines also show high peaks but appear slightly more volatile.
* **A-Anchored Series (Dashed Lines):** Consistently perform worse than the Q-Anchored versions of the same dataset. The orange (PopQA) and red (TriviaQA) lines often reside in the lower half of the chart, frequently below 40% accuracy. The gray (HotpotQA) and light blue (NQ) lines show moderate performance, often fluctuating between 20-60%.
* **Spatial Grounding:** The legend is positioned below the two chart panels. The highest accuracy peaks for Q-Anchored methods are concentrated in the right half of the chart (layers 15-30).
**Llama-3-70B Chart (Right):**
* **General Trend:** Similar high-variance, noisy pattern as the 8B model, but across a greater number of layers (0-80).
* **Q-Anchored Series (Solid Lines):** Again, these lines (blue, green, purple, pink) dominate the upper region of the chart. They show sustained high accuracy (often 60-100%) across a broad range of layers, particularly from layer 20 onwards. The blue (PopQA) and green (TriviaQA) lines are again among the top performers.
* **A-Anchored Series (Dashed Lines):** These lines (orange, red, gray, light blue) are clearly separated and generally occupy the lower portion of the chart, mostly below 60% accuracy. The orange (PopQA) and red (TriviaQA) lines are notably the lowest, often dipping below 20%.
* **Spatial Grounding:** The performance gap between Q-Anchored (top) and A-Anchored (bottom) methods is visually stark and consistent across the entire layer range. The highest density of high-accuracy points for Q-Anchored methods is in the central to right portion of the chart (layers 30-80).
### Key Observations
1. **Anchoring Method Dominance:** The most prominent pattern is the consistent and significant performance advantage of **Q-Anchored** prompting (solid lines) over **A-Anchored** prompting (dashed lines) for every single dataset, in both models.
2. **Dataset Hierarchy:** Within each anchoring method, a rough performance hierarchy is visible. For Q-Anchored, PopQA (blue) and TriviaQA (green) tend to be the top performers. For A-Anchored, HotpotQA (gray) and NQ (light blue) often outperform PopQA (orange) and TriviaQA (red).
3. **Model Scale Comparison:** The larger Llama-3-70B model shows a more sustained high-accuracy region for Q-Anchored methods across its many layers, whereas the 8B model's high accuracy is more concentrated in specific layer bands.
4. **Layer-wise Volatility:** Accuracy is not stable across layers; it fluctuates dramatically. This suggests that the model's internal representations for factual recall are highly specialized and not uniformly good at all processing stages.
5. **Performance Floor:** A-Anchored methods, especially on PopQA and TriviaQA, frequently hit a performance floor near or below 20% accuracy, indicating a near-total failure of this prompting strategy for those tasks at many layers.
### Interpretation
This data strongly suggests that **how a question is presented to the model's internal layers (the anchoring method) is a critical factor for eliciting accurate factual knowledge**, far more so than the specific layer being probed. The Q-Anchored method, which likely involves conditioning the model on the question throughout its processing, consistently unlocks much higher accuracy than the A-Anchored method (conditioning on the answer).
The high layer-to-layer variance indicates that factual knowledge in these LLMs is not stored in a monolithic, easily accessible "database." Instead, it appears to be distributed and dynamically processed, with different layers specializing in different aspects of the retrieval or reasoning process. The superior performance of the larger model (70B) suggests that increased model capacity leads to more robust and widely distributed knowledge representations.
The consistent dataset hierarchy (e.g., PopQA being easier for Q-Anchored but harder for A-Anchored) implies that the nature of the knowledge (e.g., popularity-based vs. trivia-based) interacts differently with the prompting strategy. This has practical implications: optimal prompting may be task-dependent. The charts serve as a powerful visualization that probing a model's internals is not a straightforward readout, but a complex interaction between the model's architecture, the prompting technique, and the nature of the knowledge being sought.
DECODING INTELLIGENCE...