## Line Chart: LLM Accuracy vs. Interactions
### Overview
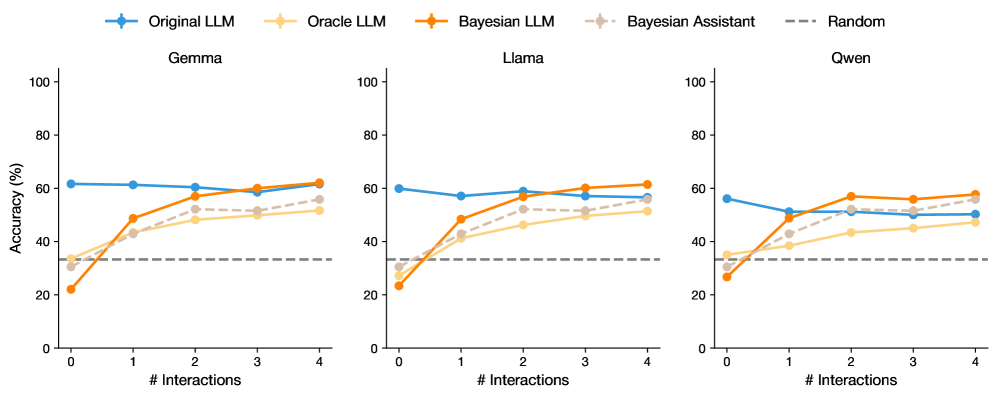
The image presents three line charts comparing the accuracy of different Language Learning Models (LLMs) across a varying number of interactions. The charts are titled "Gemma", "Llama", and "Qwen". Each chart displays the accuracy (in percentage) on the y-axis against the number of interactions on the x-axis. Five different LLM configurations are compared: "Original LLM", "Oracle LLM", "Bayesian LLM", "Bayesian Assistant", and a "Random" baseline.
### Components/Axes
* **X-axis:** "# Interactions" ranging from 0 to 4 in integer increments.
* **Y-axis:** "Accuracy (%)" ranging from 0 to 100 in increments of 20.
* **Titles:** "Gemma" (left), "Llama" (center), "Qwen" (right).
* **Legend (Top):**
* Blue: "Original LLM"
* Light Orange: "Oracle LLM"
* Orange: "Bayesian LLM"
* Light Gray: "Bayesian Assistant"
* Dashed Gray: "Random"
### Detailed Analysis
#### Gemma Chart (Left)
* **Original LLM (Blue):** Starts at approximately 62% accuracy and remains relatively constant, ending at approximately 59%.
* **Oracle LLM (Light Orange):** Starts at approximately 32% accuracy and increases to approximately 52% at 1 interaction, then increases gradually to approximately 55% at 4 interactions.
* **Bayesian LLM (Orange):** Starts at approximately 22% accuracy, increases sharply to approximately 48% at 1 interaction, and then increases to approximately 60% at 4 interactions.
* **Bayesian Assistant (Light Gray):** Starts at approximately 32% accuracy, increases to approximately 50% at 1 interaction, and then increases to approximately 54% at 4 interactions.
* **Random (Dashed Gray):** Constant at approximately 33% accuracy.
#### Llama Chart (Center)
* **Original LLM (Blue):** Starts at approximately 59% accuracy and remains relatively constant, ending at approximately 62%.
* **Oracle LLM (Light Orange):** Starts at approximately 30% accuracy and increases to approximately 45% at 1 interaction, then increases gradually to approximately 55% at 4 interactions.
* **Bayesian LLM (Orange):** Starts at approximately 22% accuracy, increases sharply to approximately 49% at 1 interaction, and then increases to approximately 65% at 4 interactions.
* **Bayesian Assistant (Light Gray):** Starts at approximately 30% accuracy, increases to approximately 42% at 1 interaction, and then increases to approximately 55% at 4 interactions.
* **Random (Dashed Gray):** Constant at approximately 33% accuracy.
#### Qwen Chart (Right)
* **Original LLM (Blue):** Starts at approximately 56% accuracy, decreases to approximately 50% at 1 interaction, and then increases slightly to approximately 51% at 4 interactions.
* **Oracle LLM (Light Orange):** Starts at approximately 30% accuracy and increases to approximately 40% at 1 interaction, then increases gradually to approximately 52% at 4 interactions.
* **Bayesian LLM (Orange):** Starts at approximately 28% accuracy, increases sharply to approximately 48% at 1 interaction, and then increases to approximately 58% at 4 interactions.
* **Bayesian Assistant (Light Gray):** Starts at approximately 35% accuracy, increases to approximately 45% at 1 interaction, and then increases to approximately 52% at 4 interactions.
* **Random (Dashed Gray):** Constant at approximately 33% accuracy.
### Key Observations
* The "Original LLM" generally maintains a relatively stable accuracy across all three charts, with a slight decrease in the "Qwen" chart.
* The "Bayesian LLM" shows the most significant improvement in accuracy with increasing interactions across all three charts.
* The "Oracle LLM" and "Bayesian Assistant" show similar trends, with moderate improvements in accuracy as the number of interactions increases.
* The "Random" baseline remains constant across all interaction levels and charts.
* The "Bayesian LLM" consistently outperforms the "Oracle LLM" and "Bayesian Assistant" after a few interactions.
### Interpretation
The data suggests that the "Bayesian LLM" benefits the most from increased interactions, indicating that it effectively learns and adapts to new information. The "Original LLM" appears to be less sensitive to the number of interactions, maintaining a relatively stable performance. The "Random" baseline provides a benchmark for comparison, highlighting the performance gain achieved by the other LLM configurations. The "Oracle LLM" and "Bayesian Assistant" show moderate improvements with interactions, suggesting they also benefit from learning but to a lesser extent than the "Bayesian LLM". The differences in performance across the "Gemma", "Llama", and "Qwen" charts indicate that the effectiveness of these LLM configurations may vary depending on the specific dataset or task.