\n
## Line Chart: LLM Accuracy vs. Interactions
### Overview
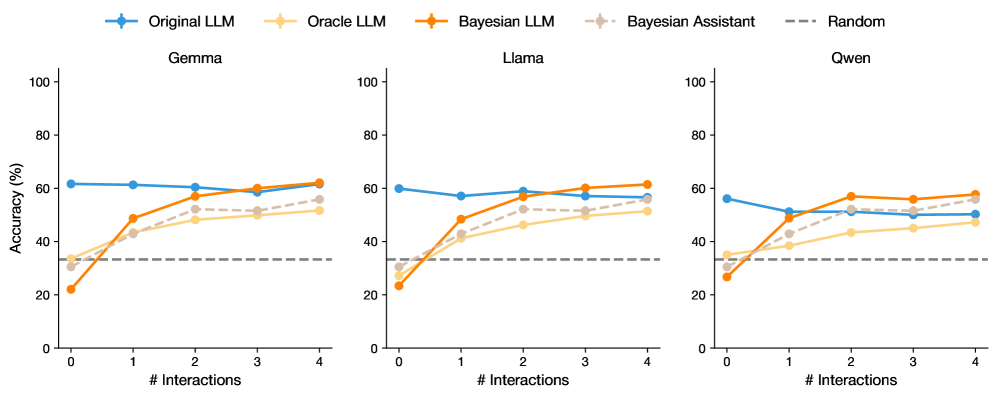
The image presents three line charts, each displaying the accuracy of different Large Language Models (LLMs) – Gemma, Llama, and Qwen – as a function of the number of interactions. Each chart compares the performance of "Original LLM", "Oracle LLM", "Bayesian LLM", "Bayesian Assistant", and a "Random" baseline. Accuracy is measured in percentage (%).
### Components/Axes
* **X-axis:** "# Interactions" ranging from 0 to 4.
* **Y-axis:** "Accuracy (%)" ranging from 0 to 100.
* **Legend:** Located at the top-right of each chart, containing the following labels and corresponding colors:
* Original LLM (Blue)
* Oracle LLM (Orange)
* Bayesian LLM (Purple)
* Bayesian Assistant (Light Orange/Peach)
* Random (Gray dashed line)
* **Chart Titles:** Gemma, Llama, and Qwen, positioned above each respective chart.
### Detailed Analysis or Content Details
**Gemma Chart:**
* **Original LLM (Blue):** Starts at approximately 58%, dips to around 54% at 1 interaction, then rises to approximately 60% at 2 interactions, and remains relatively stable around 58-60% for the remaining interactions.
* **Oracle LLM (Orange):** Starts at approximately 28%, increases steadily to around 52% at 4 interactions.
* **Bayesian LLM (Purple):** Starts at approximately 32%, increases to around 48% at 2 interactions, and plateaus around 50-52% for the remaining interactions.
* **Bayesian Assistant (Light Orange/Peach):** Starts at approximately 28%, increases to around 45% at 2 interactions, and plateaus around 45-48% for the remaining interactions.
* **Random (Gray dashed line):** Maintains a constant value of approximately 30% across all interactions.
**Llama Chart:**
* **Original LLM (Blue):** Starts at approximately 58%, dips to around 54% at 1 interaction, then rises to approximately 60% at 2 interactions, and remains relatively stable around 58-60% for the remaining interactions.
* **Oracle LLM (Orange):** Starts at approximately 28%, increases steadily to around 52% at 4 interactions.
* **Bayesian LLM (Purple):** Starts at approximately 32%, increases to around 48% at 2 interactions, and plateaus around 50-52% for the remaining interactions.
* **Bayesian Assistant (Light Orange/Peach):** Starts at approximately 28%, increases to around 45% at 2 interactions, and plateaus around 45-48% for the remaining interactions.
* **Random (Gray dashed line):** Maintains a constant value of approximately 30% across all interactions.
**Qwen Chart:**
* **Original LLM (Blue):** Starts at approximately 58%, dips to around 54% at 1 interaction, then rises to approximately 60% at 2 interactions, and remains relatively stable around 58-60% for the remaining interactions.
* **Oracle LLM (Orange):** Starts at approximately 28%, increases steadily to around 52% at 4 interactions.
* **Bayesian LLM (Purple):** Starts at approximately 32%, increases to around 48% at 2 interactions, and plateaus around 50-52% for the remaining interactions.
* **Bayesian Assistant (Light Orange/Peach):** Starts at approximately 28%, increases to around 45% at 2 interactions, and plateaus around 45-48% for the remaining interactions.
* **Random (Gray dashed line):** Maintains a constant value of approximately 30% across all interactions.
All three charts exhibit identical trends and approximate values for each LLM type.
### Key Observations
* The "Original LLM" consistently demonstrates the highest accuracy across all three models (Gemma, Llama, and Qwen), remaining above the "Random" baseline.
* The "Oracle LLM" shows a consistent increase in accuracy with more interactions, starting below the "Random" baseline and eventually surpassing it.
* Both "Bayesian LLM" and "Bayesian Assistant" show improvement with interactions, but their accuracy plateaus after 2 interactions.
* The "Random" baseline remains constant, providing a benchmark for performance.
* The three charts are nearly identical, suggesting the observed trends are consistent across the different LLMs.
### Interpretation
The data suggests that the "Original LLM" configuration performs best across all three models, indicating its inherent capabilities. The "Oracle LLM" benefits from increased interactions, suggesting it learns and improves with more data or feedback. The "Bayesian" approaches show initial improvement but reach a plateau, potentially indicating limitations in their learning mechanisms or the need for more complex models. The consistent performance of the "Random" baseline highlights the value of the LLMs in exceeding random chance. The near-identical trends across Gemma, Llama, and Qwen suggest a common underlying pattern in how these LLMs respond to interactions and learning strategies. The initial dip in accuracy for the "Original LLM" at 1 interaction could be due to a temporary disruption or adjustment period before the model stabilizes. The fact that all models outperform the random baseline indicates that they are all learning and improving, even if at different rates and to different extents.