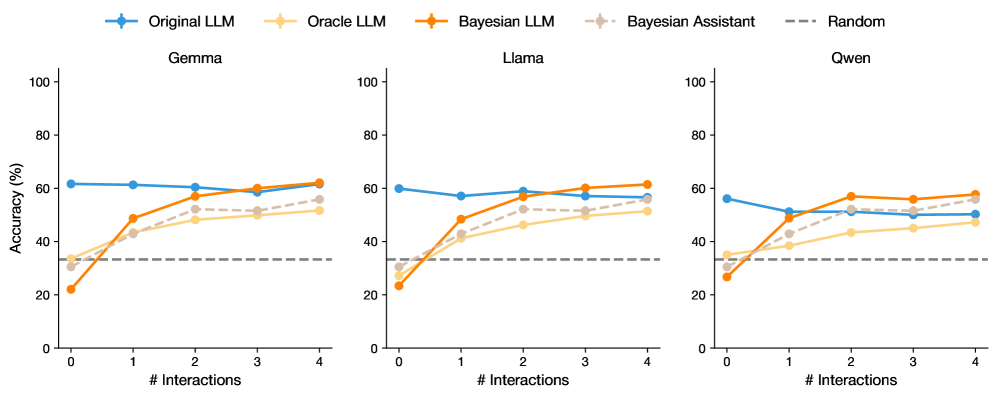
## Line Chart: Model Accuracy vs. Number of Interactions
### Overview
The image displays three subplots comparing the accuracy trends of five models (Original LLM, Oracle LLM, Bayesian LLM, Bayesian Assistant, and Random) across three datasets (Gemma, Llama, Owen). Accuracy (%) is plotted against the number of interactions (0–4), with distinct color-coded lines for each model.
---
### Components/Axes
- **X-axis**: Number of Interactions (0–4, integer steps)
- **Y-axis**: Accuracy (%) (0–100, linear scale)
- **Legend**: Located at the top, with color-coded labels:
- Blue: Original LLM
- Orange: Oracle LLM
- Brown: Bayesian LLM
- Gray: Bayesian Assistant
- Dashed Gray: Random
- **Subplots**: Three separate plots labeled "Gemma," "Llama," and "Owen" (left to right).
---
### Detailed Analysis
#### Gemma Subplot
- **Original LLM (Blue)**: Starts at ~60%, remains stable (~60–62%) across all interactions.
- **Oracle LLM (Orange)**: Begins at ~30%, rises steadily to ~60% by interaction 4.
- **Bayesian LLM (Brown)**: Starts at ~20%, increases sharply to ~60% by interaction 4.
- **Bayesian Assistant (Gray)**: Begins at ~30%, rises to ~55% by interaction 4.
- **Random (Dashed Gray)**: Flat at ~30% across all interactions.
#### Llama Subplot
- **Original LLM (Blue)**: Starts at ~60%, dips to ~55% at interaction 1, then stabilizes (~55–60%).
- **Oracle LLM (Orange)**: Begins at ~30%, rises to ~50% by interaction 4.
- **Bayesian LLM (Brown)**: Starts at ~20%, jumps to ~50% at interaction 2, remains stable.
- **Bayesian Assistant (Gray)**: Begins at ~30%, peaks at ~55% at interaction 3, then drops slightly.
- **Random (Dashed Gray)**: Flat at ~30%.
#### Owen Subplot
- **Original LLM (Blue)**: Starts at ~60%, drops to ~50% at interaction 1, then stabilizes (~50–55%).
- **Oracle LLM (Orange)**: Begins at ~30%, rises to ~45% by interaction 4.
- **Bayesian LLM (Brown)**: Starts at ~20%, jumps to ~55% at interaction 2, remains stable.
- **Bayesian Assistant (Gray)**: Begins at ~30%, peaks at ~55% at interaction 4.
- **Random (Dashed Gray)**: Flat at ~30%.
---
### Key Observations
1. **Bayesian Models Outperform**: Bayesian LLM and Bayesian Assistant consistently show the steepest improvement across all datasets, surpassing other models by interaction 2–4.
2. **Oracle LLM Improves Gradually**: Oracle LLM demonstrates steady gains but lags behind Bayesian models.
3. **Original LLM Stability**: Original LLM maintains relatively stable performance, with minor fluctuations.
4. **Random Baseline**: The Random model serves as a consistent lower bound (~30%) across all datasets.
5. **Dataset Variability**:
- Gemma shows the most pronounced improvement for Bayesian models.
- Owen exhibits the largest drop in Original LLM performance at interaction 1.
---
### Interpretation
The data suggests that **Bayesian methods (LLM and Assistant)** are highly effective at improving accuracy with increased interactions, outperforming non-Bayesian models. The Oracle LLM also benefits from interactions but to a lesser extent. The Original LLM’s performance is less sensitive to interaction count, while the Random model acts as a static baseline. Notably, the Bayesian Assistant’s peak at interaction 3 in Llama and interaction 4 in Owen indicates a delayed but significant improvement. These trends highlight the importance of interaction count in model refinement, particularly for Bayesian approaches.