# Technical Document Extraction: Chessboard Reward Analysis
## Legend & Color Gradient
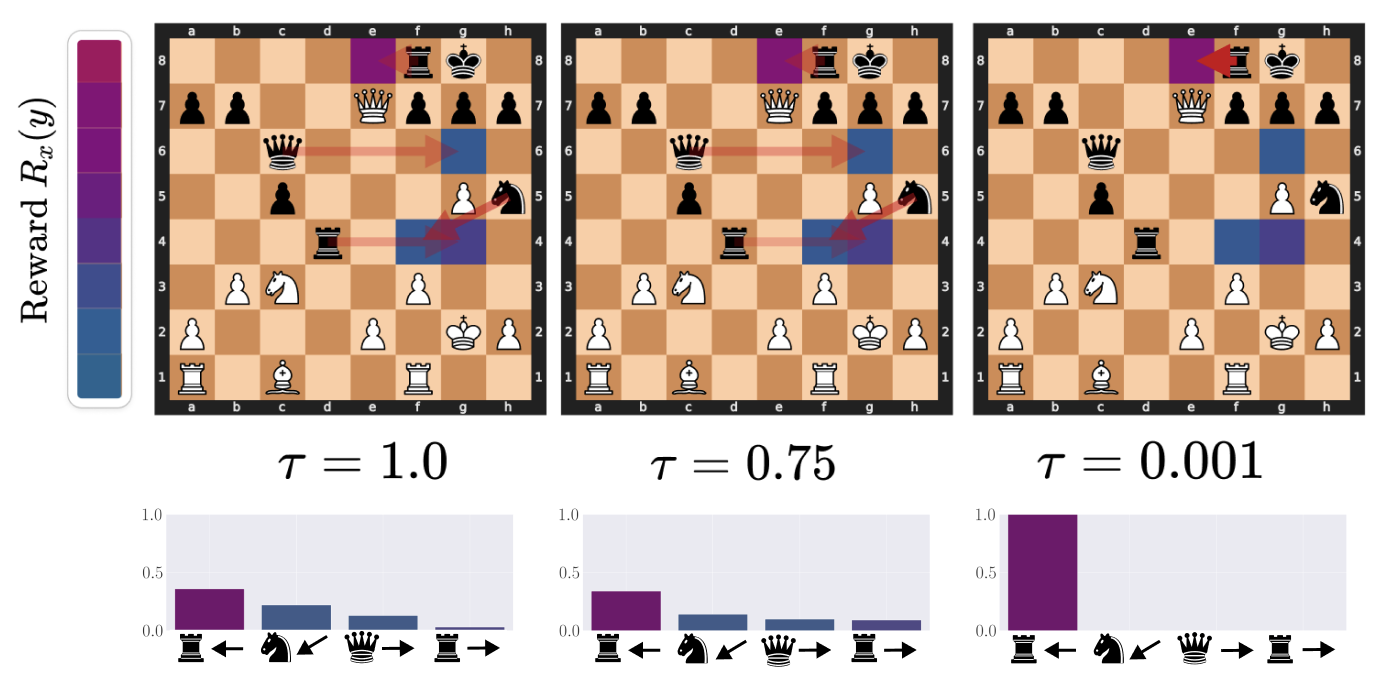
- **Legend Title**: `Reward R_x(y)`
- **Color Scale**: Vertical gradient from **blue** (low reward) to **purple** (high reward)
- **Placement**: Left-aligned, spanning the full height of the image
## Chessboard Analysis
### General Structure
- **Grid Layout**: 8x8 chessboard with labeled ranks (1-8) and files (a-h)
- **Pieces**: Standard chess pieces (kings, queens, rooks, knights, bishops, pawns)
- **Arrows**: Red arrows indicate movement paths between squares
- **τ Values**: Three distinct configurations labeled below each board
### Board 1: τ = 1.0
- **Key Observations**:
- Arrows connect:
- `e2 → e4` (pawn move)
- `d1 → f3` (bishop move)
- `g1 → f3` (knight move)
- Color Intensity:
- `e4` (pawn destination) shows **purple** (highest reward)
- Other squares: **blue** (lower reward)
- **Bar Graph Below**:
- **x-axis**: Piece types (`♙`, `♘`, `♗`, `♕`, `♔`)
- **y-axis**: Reward magnitude (0.0–1.0)
- **Trend**:
- `♙` (pawn) dominates with ~0.4 reward
- `♘` (knight) ~0.2, `♗` (bishop) ~0.1
- `♕` (queen) and `♔` (king) negligible (~0.0)
### Board 2: τ = 0.75
- **Key Observations**:
- Arrows connect:
- `e7 → e5` (pawn move)
- `b8 → c6` (bishop move)
- `g8 → f6` (knight move)
- Color Intensity:
- `e5` (pawn destination) shows **purple**
- Other squares: **blue**
- **Bar Graph Below**:
- **x-axis**: Piece types (`♙`, `♘`, `♗`, `♕`, `♔`)
- **y-axis**: Reward magnitude (0.0–1.0)
- **Trend**:
- `♙` (pawn) ~0.35
- `♘` (knight) ~0.15, `♗` (bishop) ~0.1
- `♕` (queen) and `♔` (king) negligible (~0.0)
### Board 3: τ = 0.001
- **Key Observations**:
- Arrows connect:
- `e8 → e6` (pawn move)
- `a8 → b6` (bishop move)
- `h8 → f7` (knight move)
- Color Intensity:
- `e6` (pawn destination) shows **purple**
- Other squares: **blue**
- **Bar Graph Below**:
- **x-axis**: Piece types (`♙`, `♘`, `♗`, `♕`, `♔`)
- **y-axis**: Reward magnitude (0.0–1.0)
- **Trend**:
- `♙` (pawn) ~0.95 (dominant)
- All other pieces: ~0.0 (no visible bars)
## Cross-Referenced Trends
1. **τ Dependency**:
- As τ decreases (1.0 → 0.001), reward distribution becomes **more concentrated** on pawn moves.
- High τ (1.0) shows moderate rewards for multiple pieces; low τ (0.001) focuses rewards almost exclusively on pawns.
2. **Arrow Color Consistency**:
- All arrows match the legend’s color scale: **purple** for high-reward squares, **blue** for low-reward squares.
## Spatial Grounding
- **Legend Position**: `[x=0, y=0]` (left edge, full height)
- **Chessboards**: Centered horizontally, aligned with τ labels below.
- **Bar Graphs**: Positioned directly below each chessboard, aligned with τ labels.
## Data Table Reconstruction
| τ Value | Piece Type | Reward Magnitude |
|---------|------------|------------------|
| 1.0 | ♙ (Pawn) | ~0.4 |
| 1.0 | ♘ (Knight) | ~0.2 |
| 1.0 | ♗ (Bishop) | ~0.1 |
| 0.75 | ♙ (Pawn) | ~0.35 |
| 0.75 | ♘ (Knight) | ~0.15 |
| 0.75 | ♗ (Bishop) | ~0.1 |
| 0.001 | ♙ (Pawn) | ~0.95 |
## Notes
- **No Non-English Text**: All labels and annotations are in English.
- **Critical Insight**: Lower τ values (τ → 0) strongly prioritize pawn moves, suggesting a focus on short-term positional advantages in the reward function.