## Scatter Plot: GFLOPs/Watt vs. Date for Different Precision Levels
### Overview
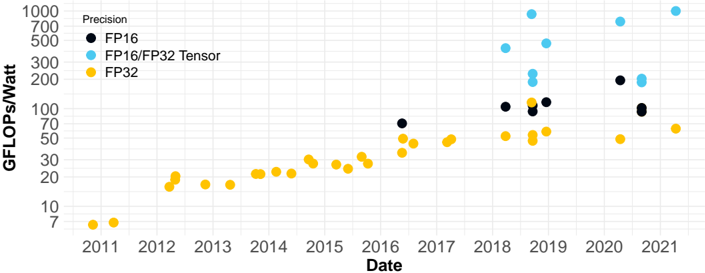
The image is a scatter plot showing the relationship between GFLOPs/Watt (performance per watt) and Date (year) for three different precision levels: FP16, FP16/FP32 Tensor, and FP32. The plot illustrates how performance per watt has changed over time for each precision level.
### Components/Axes
* **Title:** None explicitly present in the image.
* **X-axis:**
* Label: "Date"
* Scale: Years from 2011 to 2021 in increments of 1 year.
* **Y-axis:**
* Label: "GFLOPs/Watt"
* Scale: Logarithmic scale from 7 to 1000. Major tick marks are at 7, 10, 20, 30, 50, 70, 100, 200, 300, 500, 700, and 1000.
* **Legend (Top-Left):**
* "Precision"
* Black circle: "FP16"
* Light Blue circle: "FP16/FP32 Tensor"
* Yellow circle: "FP32"
### Detailed Analysis
**FP32 (Yellow):**
* **Trend:** Generally increasing over time.
* **Data Points:**
* 2011: ~7 GFLOPs/Watt
* 2012: ~15 GFLOPs/Watt
* 2013: ~17 GFLOPs/Watt
* 2014: ~22 GFLOPs/Watt
* 2015: ~23 GFLOPs/Watt
* 2016: ~28 GFLOPs/Watt
* 2017: ~35 GFLOPs/Watt
* 2018: ~40 GFLOPs/Watt
* 2019: ~45 GFLOPs/Watt
* 2020: ~55 GFLOPs/Watt
* 2021: ~70 GFLOPs/Watt
**FP16 (Black):**
* **Trend:** Data only available from 2016 onwards. Performance increases, then plateaus, and then increases again.
* **Data Points:**
* 2016: ~75 GFLOPs/Watt
* 2018: ~100 GFLOPs/Watt
* 2019: ~110 GFLOPs/Watt
* 2020: ~210 GFLOPs/Watt
* 2021: ~110 GFLOPs/Watt
**FP16/FP32 Tensor (Light Blue):**
* **Trend:** Data only available from 2018 onwards. Performance increases sharply and then decreases.
* **Data Points:**
* 2018: ~250 GFLOPs/Watt
* 2019: ~450 GFLOPs/Watt
* 2020: ~250 GFLOPs/Watt
### Key Observations
* FP32 performance per watt shows a consistent, gradual increase over the entire period from 2011 to 2021.
* FP16 and FP16/FP32 Tensor data are only available from 2018 onwards.
* FP16/FP32 Tensor achieves the highest performance per watt, peaking around 2019.
* FP16 performance per watt shows a significant jump in 2020.
### Interpretation
The plot demonstrates the evolution of performance per watt for different floating-point precision levels. The consistent increase in FP32 performance suggests ongoing improvements in hardware and software optimization for this standard precision. The introduction and subsequent performance of FP16 and FP16/FP32 Tensor indicate a shift towards lower-precision computing to achieve higher performance per watt, particularly for specialized tasks like tensor operations. The peak in FP16/FP32 Tensor performance around 2019, followed by a decrease, could be attributed to changes in hardware architectures or software optimization strategies. The jump in FP16 performance in 2020 suggests a renewed focus on optimizing this precision level. Overall, the data highlights the trade-offs between precision and energy efficiency in computing.