## Scatter Plot: Precision (GFLOPs/Watt) vs. Date (2011-2021)
### Overview
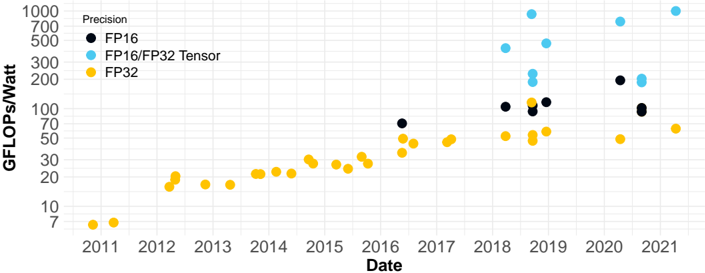
This is a scatter plot chart tracking the computational efficiency, measured in GFLOPs per Watt (Giga Floating-Point Operations per Second per Watt), of different numerical precision formats over time from 2011 to 2021. The chart uses a logarithmic scale on the y-axis. The data points are color-coded by precision type, showing a general upward trend in efficiency for all formats, with the most significant gains appearing after 2017.
### Components/Axes
* **Chart Title:** "Precision" (located in the top-left corner, above the legend).
* **Y-Axis:**
* **Label:** "GFLOPs/Watt" (vertical text on the left side).
* **Scale:** Logarithmic.
* **Markers/Ticks:** 7, 10, 20, 30, 50, 70, 100, 200, 300, 500, 700, 1000.
* **X-Axis:**
* **Label:** "Date" (horizontal text at the bottom).
* **Scale:** Linear, representing years.
* **Markers/Ticks:** 2011, 2012, 2013, 2014, 2015, 2016, 2017, 2018, 2019, 2020, 2021.
* **Legend:**
* **Position:** Top-left corner, below the title.
* **Items:**
1. **FP16** (Black circle)
2. **FP16/FP32 Tensor** (Light blue circle)
3. **FP32** (Yellow circle)
### Detailed Analysis
The chart plots three distinct data series. Below is an analysis of each, including approximate values and trends.
**1. FP32 (Yellow Circles)**
* **Trend:** Shows a steady, gradual upward slope from 2011 to 2017, followed by a more variable but generally increasing trend from 2018 onward.
* **Data Points (Approximate GFLOPs/Watt):**
* 2011: ~7
* 2012: ~15, ~18
* 2013: ~15
* 2014: ~20, ~22, ~25
* 2015: ~25, ~28, ~30
* 2016: ~25, ~28, ~30, ~35, ~40, ~45
* 2017: ~45, ~50
* 2018: ~50, ~55, ~60, ~65, ~70
* 2019: ~50, ~55, ~60, ~65, ~70, ~100
* 2020: ~50
* 2021: ~60
**2. FP16 (Black Circles)**
* **Trend:** Data points first appear in 2016. The trend shows a sharp increase from 2016 to 2019, then plateaus with some variation.
* **Data Points (Approximate GFLOPs/Watt):**
* 2016: ~70
* 2018: ~100, ~110
* 2019: ~100, ~110, ~120
* 2020: ~200
* 2021: ~90, ~100
**3. FP16/FP32 Tensor (Light Blue Circles)**
* **Trend:** Data points first appear in 2018. This series shows the most dramatic and rapid increase, reaching the highest values on the chart by 2019-2021.
* **Data Points (Approximate GFLOPs/Watt):**
* 2018: ~150, ~200, ~250, ~400
* 2019: ~150, ~200, ~250, ~500, ~1000
* 2020: ~700
* 2021: ~1000
### Key Observations
1. **Efficiency Growth:** All precision formats show improved GFLOPs/Watt over the decade, indicating hardware/software advancements in energy-efficient computing.
2. **Tensor Core Impact:** The introduction of "FP16/FP32 Tensor" precision (likely associated with specialized hardware like Tensor Cores) in 2018 correlates with a massive jump in peak efficiency, surpassing both standard FP16 and FP32.
3. **Performance Tiers:** A clear hierarchy emerges post-2018: Tensor > FP16 > FP32 in terms of peak efficiency.
4. **Data Sparsity:** There are no data points for FP16 or Tensor precisions before 2016 and 2018, respectively, suggesting these measurement categories or the hardware supporting them were not prevalent or measured earlier.
5. **2019 Peak:** The year 2019 shows the highest density of high-performance data points, especially for the Tensor series, with one point reaching the top of the scale (~1000 GFLOPs/Watt).
### Interpretation
This chart visually documents the evolution of energy efficiency in computational hardware, likely for graphics processing units (GPUs) or AI accelerators, over an 11-year period. The data suggests:
* **Moore's Law & Beyond:** The steady rise in FP32 efficiency reflects traditional scaling. The explosive growth in Tensor efficiency after 2018 demonstrates a paradigm shift, where architectural innovation (specialized tensor processing units) yields greater efficiency gains than process node scaling alone.
* **The AI Hardware Revolution:** The appearance and dominance of the "FP16/FP32 Tensor" series strongly correlate with the industry's push for hardware optimized for deep learning workloads, where mixed-precision and tensor operations are fundamental. The chart quantifies the dramatic efficiency advantage this specialized hardware provides.
* **Practical Implications:** Higher GFLOPs/Watt translates directly to more computational work done per unit of energy, which is critical for reducing operational costs in data centers, enabling more powerful edge devices, and addressing the environmental impact of large-scale computing. The outlier at ~1000 GFLOPs/Watt in 2019 represents a state-of-the-art milestone at that time.
* **Measurement Context:** The absence of earlier data for FP16 and Tensor formats may indicate when these precision modes became standard, commercially available, or relevant for benchmarking in the context of AI/ML workloads.