## Chart Type: Line Graphs Comparing Two Methods
### Overview
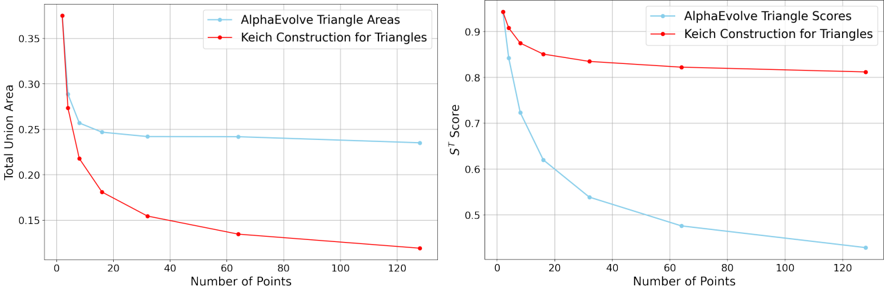
The image contains two line graphs side-by-side, comparing the performance of "AlphaEvolve" and "Keich Construction" methods for triangles. The left graph plots "Total Union Area" against "Number of Points," while the right graph plots "S^T Score" against "Number of Points." Both graphs show the performance of the two methods as the number of points increases.
### Components/Axes
**Left Graph:**
* **Title:** Implicit, but can be inferred as comparison of area metrics.
* **Y-axis:** "Total Union Area" with a scale from 0.15 to 0.35 in increments of 0.05.
* **X-axis:** "Number of Points" with a scale from 0 to 120 in increments of 20.
* **Legend:** Located in the top-right corner.
* Light Blue: "AlphaEvolve Triangle Areas"
* Red: "Keich Construction for Triangles"
**Right Graph:**
* **Title:** Implicit, but can be inferred as comparison of score metrics.
* **Y-axis:** "S^T Score" with a scale from 0.5 to 0.9 in increments of 0.1.
* **X-axis:** "Number of Points" with a scale from 0 to 120 in increments of 20.
* **Legend:** Located in the top-right corner.
* Light Blue: "AlphaEvolve Triangle Scores"
* Red: "Keich Construction for Triangles"
### Detailed Analysis
**Left Graph (Total Union Area):**
* **AlphaEvolve Triangle Areas (Light Blue):** The line starts at approximately 0.27 at 0 points, decreases slightly to approximately 0.26 at 10 points, and then plateaus around 0.24 for the rest of the x-axis.
* (0, 0.27)
* (10, 0.26)
* (20, 0.25)
* (40, 0.24)
* (60, 0.24)
* (80, 0.24)
* (120, 0.24)
* **Keich Construction for Triangles (Red):** The line starts at approximately 0.37 at 0 points, decreases rapidly to approximately 0.22 at 10 points, and continues to decrease, but at a slower rate, to approximately 0.13 at 120 points.
* (0, 0.37)
* (10, 0.22)
* (20, 0.18)
* (40, 0.16)
* (60, 0.15)
* (80, 0.14)
* (120, 0.13)
**Right Graph (S^T Score):**
* **AlphaEvolve Triangle Scores (Light Blue):** The line starts at approximately 0.88 at 0 points, decreases rapidly to approximately 0.72 at 10 points, and continues to decrease, but at a slower rate, to approximately 0.42 at 120 points.
* (0, 0.88)
* (10, 0.72)
* (20, 0.60)
* (40, 0.54)
* (60, 0.50)
* (80, 0.47)
* (120, 0.42)
* **Keich Construction for Triangles (Red):** The line starts at approximately 0.94 at 0 points, decreases to approximately 0.88 at 10 points, and then decreases slowly to approximately 0.82 at 120 points.
* (0, 0.94)
* (10, 0.88)
* (20, 0.86)
* (40, 0.84)
* (60, 0.84)
* (80, 0.83)
* (120, 0.82)
### Key Observations
* In the left graph (Total Union Area), the "Keich Construction" method starts with a higher value but decreases more rapidly than "AlphaEvolve," eventually resulting in a lower total union area as the number of points increases.
* In the right graph (S^T Score), the "Keich Construction" method consistently outperforms "AlphaEvolve" across all numbers of points. Both methods show a decrease in score as the number of points increases, but "AlphaEvolve" decreases more rapidly.
### Interpretation
The graphs suggest that while "Keich Construction" initially produces triangles with a higher total union area, its performance degrades more significantly as the number of points increases. In contrast, "AlphaEvolve" maintains a more stable total union area. However, when considering the "S^T Score," "Keich Construction" consistently achieves higher scores than "AlphaEvolve," indicating a potentially better overall triangle quality based on this metric. The choice between the two methods would depend on the specific application and the relative importance of total union area versus the S^T score. The rapid initial decline in both metrics for both methods suggests that the initial points are critical for performance.