## Charts: AlphaEvolve vs. Keich Construction for Triangles
### Overview
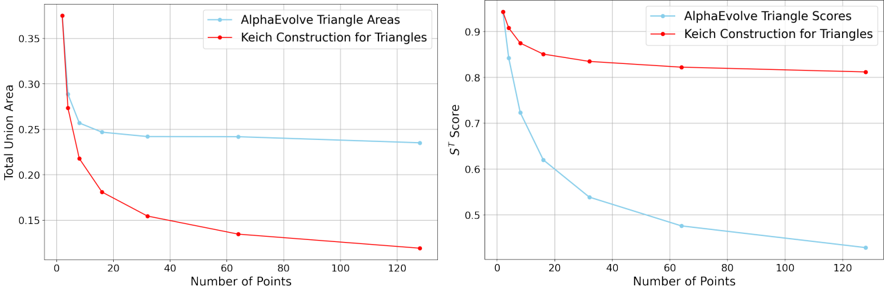
The image presents two line charts comparing the performance of "AlphaEvolve" and "Keich Construction" methods for triangles, based on the number of points used. The left chart displays "Total Union Area", while the right chart shows "ST Score". Both charts share a common x-axis representing the "Number of Points".
### Components/Axes
* **X-axis (Both Charts):** "Number of Points", ranging from 0 to 120, with tick marks at intervals of 20.
* **Left Chart Y-axis:** "Total Union Area", ranging from 0.15 to 0.35, with tick marks at intervals of 0.05.
* **Right Chart Y-axis:** "ST Score", ranging from 0.75 to 0.95, with tick marks at intervals of 0.05.
* **Left Chart Legend (Top-Right):**
* Light Blue Line: "AlphaEvolve Triangle Areas"
* Red Line: "Keich Construction for Triangles"
* **Right Chart Legend (Top-Right):**
* Light Blue Line: "AlphaEvolve Triangle Scores"
* Red Line: "Keich Construction for Triangles"
### Detailed Analysis or Content Details
**Left Chart: Total Union Area vs. Number of Points**
* **AlphaEvolve Triangle Areas (Light Blue Line):** The line starts at approximately 0.27 at 0 points, decreases sharply to around 0.24 at 20 points, and then gradually levels off, reaching approximately 0.22 at 120 points. The trend is a decreasing curve, but the rate of decrease diminishes with increasing points.
* **Keich Construction for Triangles (Red Line):** The line begins at approximately 0.21 at 0 points, decreases rapidly to around 0.16 at 20 points, and continues to decrease, but at a slower rate, reaching approximately 0.13 at 120 points. This line consistently remains below the AlphaEvolve line.
**Right Chart: ST Score vs. Number of Points**
* **AlphaEvolve Triangle Scores (Light Blue Line):** The line starts at approximately 0.92 at 0 points, drops dramatically to around 0.55 at 20 points, and then continues to decrease, leveling off around 0.45 at 120 points. The initial drop is very steep.
* **Keich Construction for Triangles (Red Line):** The line begins at approximately 0.94 at 0 points, decreases to around 0.87 at 20 points, and then levels off, remaining around 0.83 at 120 points. This line remains consistently above the AlphaEvolve line.
### Key Observations
* In the "Total Union Area" chart, AlphaEvolve consistently yields a higher area than Keich Construction across all point counts.
* In the "ST Score" chart, Keich Construction consistently yields a higher score than AlphaEvolve across all point counts.
* Both methods show diminishing returns as the number of points increases. The most significant changes in both metrics occur within the first 20 points.
* The AlphaEvolve ST Score decreases much more rapidly than the Keich Construction ST Score.
### Interpretation
The data suggests a trade-off between the "Total Union Area" and the "ST Score" when comparing AlphaEvolve and Keich Construction for triangles. AlphaEvolve appears to maximize the total area covered by the triangles, while Keich Construction optimizes for a higher ST Score, which could represent some measure of shape quality or similarity.
The rapid initial decrease in both metrics indicates that adding a small number of points (e.g., up to 20) has the most significant impact on both area and score. Beyond 20 points, the improvements become marginal.
The consistent separation between the two lines in both charts suggests that the choice between AlphaEvolve and Keich Construction depends on the specific application and the relative importance of area versus score. If maximizing area is crucial, AlphaEvolve is preferred. If maximizing score is crucial, Keich Construction is preferred. The fact that the ST Score decreases for AlphaEvolve as points are added suggests that the method may become less stable or accurate with increasing complexity.