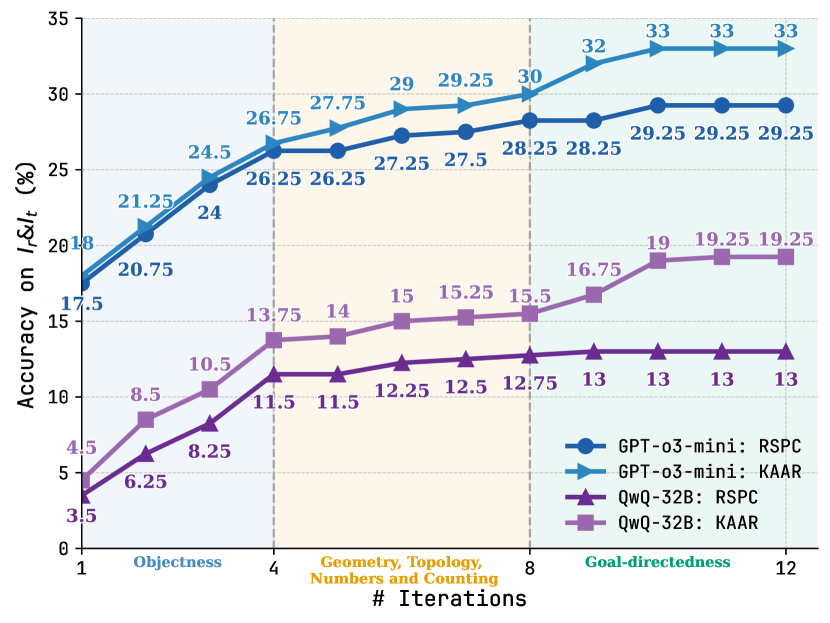
## Line Chart: Accuracy on IδLt vs. Iterations
### Overview
This line chart displays the accuracy on IδLt (%) for four different models (GPT-o3-mini with RSPC and KAAR, and QwQ-32B with RSPC and KAAR) across a range of iterations, from 1 to 12. The x-axis represents the number of iterations, and the y-axis represents the accuracy percentage. The chart is divided into three sections based on the task: Objectness (iterations 1-4), Geometry, Topology, Numbers and Counting (iterations 4-8), and Goal-directedness (iterations 8-12).
### Components/Axes
* **X-axis:** "# Iterations" - Scale from 1 to 12. Marked with vertical dashed lines at 1, 4, 8, and 12, corresponding to the task divisions.
* **Y-axis:** "Accuracy on IδLt (%)" - Scale from 3.5 to 35.
* **Legend:** Located in the top-right corner. Contains the following labels and corresponding colors:
* GPT-o3-mini: RSPC (Blue)
* GPT-o3-mini: KAAR (Green)
* QwQ-32B: RSPC (Red)
* QwQ-32B: KAAR (Brown)
### Detailed Analysis
The chart shows four distinct lines, each representing a model's performance.
**GPT-o3-mini: RSPC (Blue)**
* Trend: The line generally slopes upward, indicating increasing accuracy with more iterations. The slope is steeper in the initial stages and flattens out towards the end.
* Data Points:
* Iteration 1: ~21.25%
* Iteration 4: ~26.75%
* Iteration 8: ~29%
* Iteration 12: ~33%
**GPT-o3-mini: KAAR (Green)**
* Trend: Similar to RSPC, the line slopes upward, but starts at a lower accuracy and has a less steep slope overall.
* Data Points:
* Iteration 1: ~20.75%
* Iteration 4: ~26.25%
* Iteration 8: ~28.25%
* Iteration 12: ~29.25%
**QwQ-32B: RSPC (Red)**
* Trend: The line shows an upward trend, but with more fluctuations than the GPT-o3-mini lines.
* Data Points:
* Iteration 1: ~4.5%
* Iteration 4: ~11.5%
* Iteration 8: ~15.5%
* Iteration 12: ~19%
**QwQ-32B: KAAR (Brown)**
* Trend: The line also slopes upward, but starts at the lowest accuracy and has the least steep slope.
* Data Points:
* Iteration 1: ~6.25%
* Iteration 4: ~11.5%
* Iteration 8: ~12.75%
* Iteration 12: ~19.25%
### Key Observations
* GPT-o3-mini consistently outperforms QwQ-32B across all iterations and tasks.
* RSPC generally yields higher accuracy than KAAR for both models.
* The rate of accuracy improvement decreases as the number of iterations increases, suggesting diminishing returns.
* The largest performance gains are observed during the "Objectness" task (iterations 1-4).
* The QwQ-32B models plateau at a lower accuracy level compared to the GPT-o3-mini models.
### Interpretation
The data suggests that GPT-o3-mini, particularly when used with RSPC, is more effective at achieving higher accuracy on the IδLt metric than QwQ-32B, regardless of whether RSPC or KAAR is used. The diminishing returns observed with increasing iterations indicate that further iterations may not significantly improve performance beyond a certain point. The task-specific performance differences suggest that the models may have varying strengths and weaknesses depending on the nature of the task. The relatively low accuracy of QwQ-32B models suggests they may require further optimization or a different approach to achieve comparable performance to GPT-o3-mini. The IδLt metric likely measures some form of logical or reasoning ability, and the chart demonstrates the iterative improvement of these models on that metric. The three tasks (Objectness, Geometry/Topology/Counting, Goal-directedness) represent increasing levels of complexity in reasoning.