\n
## Line Chart: Accuracy Trends Over Iterations for Different Models and Methods
### Overview
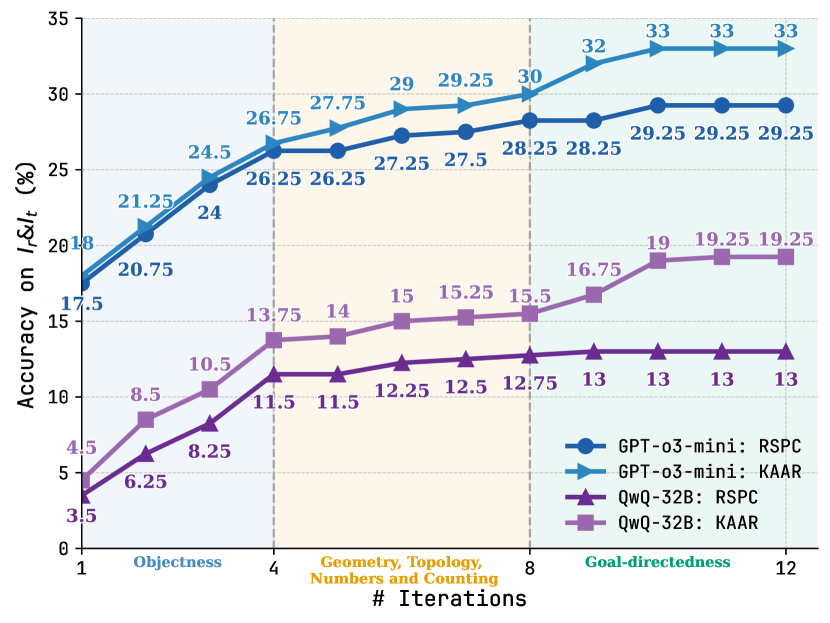
The image is a line chart displaying the performance, measured as "Accuracy on I&I_t (%)", of two different AI models (GPT-o3-mini and QwQ-32B) using two different methods (RSPC and KAAR) over a series of iterations. The chart tracks how accuracy improves as the number of iterations increases from 1 to 12. The background is divided into three vertical shaded regions, each corresponding to a different conceptual phase of the task.
### Components/Axes
* **Chart Type:** Multi-line chart with data points marked by distinct shapes.
* **X-Axis:**
* **Title:** "# Iterations"
* **Scale:** Linear, with major tick marks at 1, 4, 8, and 12.
* **Category Labels (below axis):** The axis is segmented into three phases:
1. **Objectness** (Iterations 1-4, light blue background)
2. **Geometry, Topology, Numbers and Counting** (Iterations 4-8, light orange background)
3. **Goal-directedness** (Iterations 8-12, light green background)
* **Y-Axis:**
* **Title:** "Accuracy on I&I_t (%)"
* **Scale:** Linear, ranging from 0 to 35, with major increments of 5.
* **Legend:** Located in the bottom-right corner of the chart area. It defines four data series:
1. **GPT-o3-mini: RSPC** - Dark blue line with circle markers (●).
2. **GPT-o3-mini: KAAR** - Light blue line with right-pointing triangle markers (▶).
3. **QwQ-32B: RSPC** - Dark purple line with upward-pointing triangle markers (▲).
4. **QwQ-32B: KAAR** - Light purple/lavender line with square markers (■).
### Detailed Analysis
The chart plots four distinct data series. Below is a breakdown of each, including the visual trend and extracted data points.
**1. GPT-o3-mini: KAAR (Light Blue Line, ▶)**
* **Trend:** Shows the highest overall performance. It starts strong and maintains a steady, upward slope, plateauing at the highest accuracy level in the final phase.
* **Data Points (Iteration: Accuracy %):**
* 1: 18
* 2: 21.25
* 3: 24.5
* 4: 26.75
* 5: 27.75
* 6: 29
* 7: 29.25
* 8: 30
* 9: 32
* 10: 33
* 11: 33
* 12: 33
**2. GPT-o3-mini: RSPC (Dark Blue Line, ●)**
* **Trend:** Follows a very similar trajectory to its KAAR counterpart but consistently performs slightly lower. It also plateaus in the final phase.
* **Data Points (Iteration: Accuracy %):**
* 1: 17.5
* 2: 20.75
* 3: 24
* 4: 26.25
* 5: 26.25
* 6: 27.25
* 7: 27.5
* 8: 28.25
* 9: 28.25
* 10: 29.25
* 11: 29.25
* 12: 29.25
**3. QwQ-32B: KAAR (Light Purple Line, ■)**
* **Trend:** Starts at a much lower accuracy than the GPT models but shows significant improvement, especially during the "Geometry..." and "Goal-directedness" phases. Its growth rate is steeper than the QwQ-32B: RSPC line.
* **Data Points (Iteration: Accuracy %):**
* 1: 4.5
* 2: 8.5
* 3: 10.5
* 4: 13.75
* 5: 14
* 6: 15
* 7: 15.25
* 8: 15.5
* 9: 16.75
* 10: 19
* 11: 19.25
* 12: 19.25
**4. QwQ-32B: RSPC (Dark Purple Line, ▲)**
* **Trend:** Shows the lowest performance overall. It improves gradually but plateaus earlier and at a much lower accuracy level than the other three series.
* **Data Points (Iteration: Accuracy %):**
* 1: 3.5
* 2: 6.25
* 3: 8.25
* 4: 11.5
* 5: 11.5
* 6: 12.25
* 7: 12.5
* 8: 12.75
* 9: 13
* 10: 13
* 11: 13
* 12: 13
### Key Observations
1. **Model Performance Gap:** There is a substantial and consistent performance gap between the GPT-o3-mini model (top two lines) and the QwQ-32B model (bottom two lines) across all iterations and methods.
2. **Method Superiority:** For both models, the **KAAR** method (light blue and light purple lines) consistently outperforms the **RSPC** method (dark blue and dark purple lines). The gap between KAAR and RSPC is more pronounced for the QwQ-32B model.
3. **Phase-Based Improvement:** All models show the most significant gains in accuracy during the first two phases ("Objectness" and "Geometry..."). Performance gains slow considerably or plateau during the final "Goal-directedness" phase.
4. **Plateau Points:**
* GPT-o3-mini: KAAR plateaus at 33% from iteration 10 onward.
* GPT-o3-mini: RSPC plateaus at 29.25% from iteration 10 onward.
* QwQ-32B: KAAR plateaus at 19.25% from iteration 11 onward.
* QwQ-32B: RSPC plateaus at 13% from iteration 9 onward.
### Interpretation
The data suggests a clear hierarchy in both model capability and method effectiveness for the given task (I&I_t). The GPT-o3-mini model demonstrates significantly higher baseline and peak accuracy compared to QwQ-32B, indicating it may be a more capable or better-suited model for this specific benchmark.
Furthermore, the **KAAR method provides a consistent performance boost over RSPC** for both models. This implies that the algorithmic or procedural differences in KAAR are beneficial for improving accuracy on this task. The fact that the performance gap between methods is larger for the weaker model (QwQ-32B) might suggest that KAAR is particularly effective at compensating for model limitations or extracting more latent capability.
The three-phase structure of the x-axis ("Objectness" -> "Geometry..." -> "Goal-directedness") implies the task is composite, requiring different cognitive skills. The chart shows that models make the fastest progress on foundational skills (Objectness, basic Geometry) and hit a performance ceiling when tackling the more complex, integrative skill of "Goal-directedness." This plateau could represent the current limit of these models' reasoning capabilities on this specific benchmark. The investigation would benefit from examining the specific failures in the "Goal-directedness" phase to understand the bottleneck.