## Line Charts: Action, Knowledge, and Reflection Probabilities Across Layers
### Overview
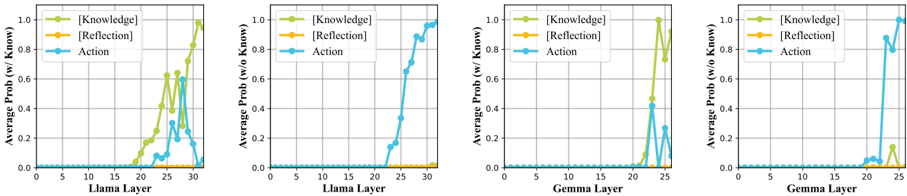
The image presents four line charts, arranged in a 2x2 grid. Each chart displays the average probability of "Action", "[Knowledge]", and "[Reflection]" across different layers of two models: "Llama Layer" (appearing twice) and "Gemma Layer" (appearing twice). The y-axis represents "Average Prob (w/ Know)" or "Average Prob (w/o Know)", ranging from 0.0 to 1.0. The x-axis represents the layer number, ranging from 0 to 30 for Llama Layer and 0 to 25 for Gemma Layer.
### Components/Axes
* **Y-axis:** "Average Prob (w/ Know)" or "Average Prob (w/o Know)", with ticks at 0.0, 0.2, 0.4, 0.6, 0.8, and 1.0.
* **X-axis:** "Llama Layer" (for the two left charts) and "Gemma Layer" (for the two right charts).
* Llama Layer: Ranges from 0 to 30, with ticks at 0, 5, 10, 15, 20, 25, and 30.
* Gemma Layer: Ranges from 0 to 25, with ticks at 0, 5, 10, 15, 20, and 25.
* **Legend (Top-Left of each chart):**
* Green: "[Knowledge]"
* Yellow: "[Reflection]"
* Blue: "Action"
### Detailed Analysis
**Chart 1: Llama Layer (Top-Left)**
* **[Knowledge] (Green):** The probability remains near 0 until layer 20, then increases to approximately 0.6 at layer 27, before decreasing to approximately 0.1 at layer 30.
* **[Reflection] (Yellow):** The probability remains near 0 across all layers.
* **Action (Blue):** The probability remains near 0 until layer 25, then increases to approximately 0.3 at layer 27, before decreasing to approximately 0.2 at layer 30.
**Chart 2: Llama Layer (Top-Right)**
* **[Knowledge] (Green):** The probability remains near 0 across all layers.
* **[Reflection] (Yellow):** The probability remains near 0 across all layers.
* **Action (Blue):** The probability remains near 0 until layer 23, then increases sharply to approximately 1.0 at layer 30.
**Chart 3: Gemma Layer (Bottom-Left)**
* **[Knowledge] (Green):** The probability remains near 0 until layer 23, then increases sharply to approximately 1.0 at layer 24, before decreasing to approximately 0.1 at layer 25.
* **[Reflection] (Yellow):** The probability remains near 0 across all layers.
* **Action (Blue):** The probability remains near 0 until layer 23, then increases to approximately 0.5 at layer 24, before decreasing to approximately 0.1 at layer 25.
**Chart 4: Gemma Layer (Bottom-Right)**
* **[Knowledge] (Green):** The probability remains near 0 until layer 24, then increases to approximately 0.1 at layer 25.
* **[Reflection] (Yellow):** The probability remains near 0 across all layers.
* **Action (Blue):** The probability remains near 0 until layer 22, then increases sharply to approximately 0.9 at layer 24, before decreasing to approximately 0.8 at layer 25.
### Key Observations
* In all four charts, the "[Reflection]" probability remains consistently near 0 across all layers.
* The "Action" probability shows a significant increase in the later layers for all charts, but the specific layer at which this increase occurs varies between the Llama Layer and Gemma Layer models.
* The "[Knowledge]" probability also increases in the later layers, but its behavior is more variable than the "Action" probability.
### Interpretation
The charts illustrate how the probabilities of "Action", "[Knowledge]", and "[Reflection]" change across different layers of the Llama Layer and Gemma Layer models. The consistent near-zero probability of "[Reflection]" suggests that this component may not be significantly activated in these models under the conditions tested. The increase in "Action" probability in the later layers indicates that the models are increasingly focusing on taking actions as they process information through deeper layers. The varying behavior of "[Knowledge]" probability suggests that its activation may be more context-dependent or model-specific. The difference in the layer at which "Action" probability increases between Llama Layer and Gemma Layer could indicate differences in the architectures or training of these models. The "Average Prob (w/ Know)" and "Average Prob (w/o Know)" labels on the y-axis suggest that the probabilities are calculated with and without considering some "Know" factor, but the specific meaning of "Know" is not defined in the image.