## Chart: Mutual Information Surprise
### Overview
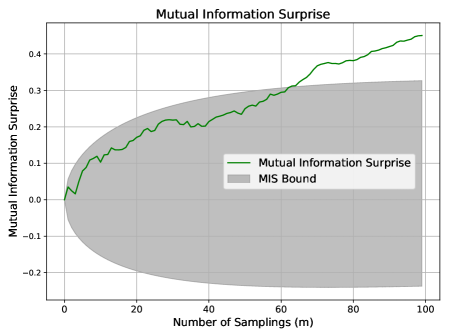
The image is a line chart displaying the "Mutual Information Surprise" as a function of the "Number of Samplings (m)". It also shows a shaded region representing the "MIS Bound". The x-axis represents the number of samplings, ranging from 0 to 100. The y-axis represents the mutual information surprise, ranging from -0.2 to 0.4.
### Components/Axes
* **Title:** Mutual Information Surprise
* **X-axis:** Number of Samplings (m), with ticks at 0, 20, 40, 60, 80, and 100.
* **Y-axis:** Mutual Information Surprise, with ticks at -0.2, -0.1, 0.0, 0.1, 0.2, 0.3, and 0.4.
* **Legend:** Located in the center-right of the chart.
* Green line: Mutual Information Surprise
* Gray shaded area: MIS Bound
### Detailed Analysis
* **Mutual Information Surprise (Green Line):**
* The line starts at approximately 0 when the number of samplings is 0.
* It increases rapidly initially, reaching approximately 0.2 around 20 samplings.
* The line continues to increase, but at a slower rate, reaching approximately 0.3 at 60 samplings.
* The line continues to increase, reaching approximately 0.45 at 100 samplings.
* **MIS Bound (Gray Shaded Area):**
* The shaded area forms an approximate ellipse centered around the x-axis.
* The lower bound starts at approximately -0.15 at 0 samplings, decreasing to approximately -0.22 at 40 samplings, then increasing back to approximately -0.15 at 100 samplings.
* The upper bound starts at approximately 0.15 at 0 samplings, increasing to approximately 0.3 at 40 samplings, then decreasing back to approximately 0.32 at 100 samplings.
### Key Observations
* The Mutual Information Surprise generally increases with the number of samplings.
* The MIS Bound forms a confidence interval around the x-axis, initially wide and then narrowing as the number of samplings increases.
* The Mutual Information Surprise line stays within the MIS Bound for the initial samplings, but then exceeds the upper bound of the MIS Bound after approximately 40 samplings.
### Interpretation
The chart suggests that as the number of samplings increases, the mutual information surprise also increases. The MIS Bound provides a measure of uncertainty, which initially decreases as more samples are collected. However, the fact that the Mutual Information Surprise exceeds the MIS Bound after a certain number of samplings could indicate that the model is becoming more confident in its predictions, or that the bound is not accurately capturing the true uncertainty. The initial rapid increase in Mutual Information Surprise suggests that the first few samples are the most informative.