\n
## Line Chart: Mutual Information Surprise
### Overview
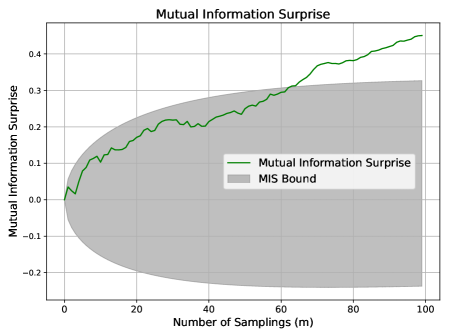
The image presents a line chart illustrating the relationship between the number of samplings (m) and the Mutual Information Surprise. A shaded region represents the MIS Bound. The chart aims to visualize how the Mutual Information Surprise changes as the number of samples increases, and how it relates to a defined bound.
### Components/Axes
* **X-axis:** Number of Samplings (m), ranging from approximately 0 to 100.
* **Y-axis:** Mutual Information Surprise, ranging from approximately -0.15 to 0.45.
* **Data Series:**
* "Mutual Information Surprise" - Represented by a green line.
* **Legend:** Located in the top-right corner.
* "Mutual Information Surprise" - Green color.
* "MIS Bound" - Gray color.
### Detailed Analysis
The green line representing "Mutual Information Surprise" starts at approximately -0.05 at m=0. The line initially slopes upward, reaching a value of approximately 0.1 at m=10. It then plateaus around 0.25 between m=20 and m=40, with some fluctuations. After m=40, the line resumes an upward trend, reaching approximately 0.42 at m=100.
The "MIS Bound" is represented by a gray shaded region. It starts at approximately -0.1 at m=0, widens as m increases, and reaches a maximum height of approximately 0.3 at m=100. The lower bound of the shaded region remains consistently negative, around -0.15, throughout the entire range of m.
Here's a breakdown of approximate data points:
| Number of Samplings (m) | Mutual Information Surprise |
|---|---|
| 0 | -0.05 |
| 10 | 0.10 |
| 20 | 0.20 |
| 30 | 0.24 |
| 40 | 0.26 |
| 50 | 0.28 |
| 60 | 0.30 |
| 70 | 0.34 |
| 80 | 0.38 |
| 90 | 0.40 |
| 100 | 0.42 |
### Key Observations
* The Mutual Information Surprise generally increases with the number of samplings.
* There's a period of relative stability in the Mutual Information Surprise between m=20 and m=40.
* The Mutual Information Surprise remains within the MIS Bound throughout the observed range of samplings.
* The MIS Bound widens as the number of samplings increases, indicating a greater potential range for the Mutual Information Surprise.
### Interpretation
The chart suggests that as more samples are taken, the Mutual Information Surprise increases, indicating a greater amount of information gained. The MIS Bound provides a theoretical limit or range for the expected Mutual Information Surprise. The fact that the Mutual Information Surprise stays within the bound suggests that the observed behavior is consistent with the theoretical model. The plateau between m=20 and m=40 could indicate a point of diminishing returns, where additional samples provide less incremental information. The widening of the MIS Bound with increasing samples suggests that the uncertainty around the Mutual Information Surprise grows as more data is collected, potentially due to the complexity of the underlying system. This could be a visualization of a convergence property, where the information gain slows down as the system approaches a stable state.