## Line Graph: Mutual Information Surprise
### Overview
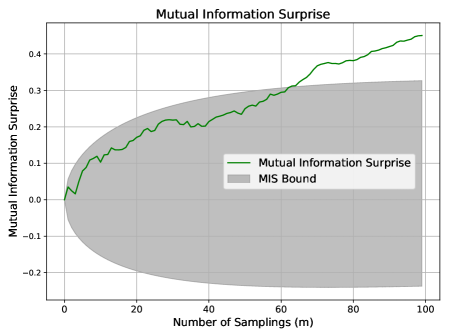
The image depicts a line graph titled "Mutual Information Surprise," illustrating the relationship between the number of samplings (m) and mutual information surprise. A green line represents the "Mutual Information Surprise" metric, while a gray shaded area labeled "MIS Bound" indicates a theoretical or empirical boundary. The graph spans 0 to 100 samplings on the x-axis and -0.2 to 0.4 on the y-axis.
### Components/Axes
- **X-axis**: "Number of Samplings (m)" (0 to 100, linear scale).
- **Y-axis**: "Mutual Information Surprise" (-0.2 to 0.4, linear scale).
- **Legend**: Located in the bottom-right corner, with:
- **Green line**: "Mutual Information Surprise."
- **Gray shaded area**: "MIS Bound."
### Detailed Analysis
1. **Mutual Information Surprise (Green Line)**:
- Starts at (0, 0.0) and increases gradually to ~0.15 at 20 samplings.
- Rises steadily to ~0.25 at 40 samplings, then accelerates to ~0.35 at 60 samplings.
- Peaks at ~0.42 at 100 samplings, showing a nonlinear upward trend.
- **Key trend**: Steeper increase after 60 samplings.
2. **MIS Bound (Gray Shaded Area)**:
- Forms a concave curve starting at (0, 0.0), peaking at ~0.3 at 60 samplings.
- Flattens to ~0.25 at 100 samplings, indicating diminishing returns.
- **Key trend**: Plateaus after 60 samplings.
3. **Intersection**:
- The green line crosses the MIS Bound near 60 samplings, surpassing it thereafter.
### Key Observations
- The mutual information surprise metric grows faster than the MIS Bound after 60 samplings.
- The MIS Bound suggests a theoretical limit (~0.3) that the actual data exceeds by ~10% at 100 samplings.
- No outliers or anomalies are visible; trends are consistent.
### Interpretation
The graph demonstrates that mutual information surprise increases with more samplings, but the MIS Bound implies a theoretical ceiling. The green line surpassing this bound after 60 samplings suggests either:
1. **Improved performance**: The system's mutual information surprise exceeds expectations, potentially indicating enhanced learning or data quality.
2. **Bound inaccuracy**: The MIS Bound may underestimate the true limit, highlighting a need for revised theoretical models.
3. **Nonlinear dynamics**: The steeper rise after 60 samplings could reflect a phase transition or saturation effect in the data.
This divergence between empirical data and theoretical bounds warrants further investigation into the system's behavior at higher sampling rates.