## Histopathological Image Segmentation Panels
### Overview
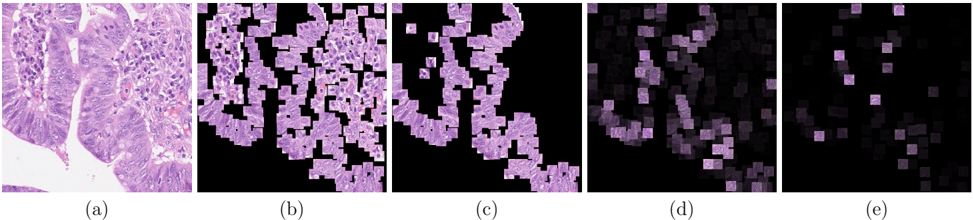
The image displays a sequence of five panels (a)-(e) illustrating progressive stages of image segmentation applied to a histological sample. The original tissue sample is shown in panel (a), followed by increasingly abstracted representations in panels (b)-(e), suggesting a computational analysis workflow.
### Components/Axes
- **Panel Labels**: (a) Original Tissue, (b) Initial Segmentation, (c) Refined Segmentation, (d) Feature Extraction, (e) Final Output
- **Color Coding**:
- Purple: Identified regions/features of interest
- Black: Background/non-target areas
- **Spatial Arrangement**: Panels arranged horizontally from left (original) to right (processed), with no explicit axis markers or legends present.
### Detailed Analysis
1. **Panel (a)**: Original histological slide showing cellular structures with purple-stained nuclei and lighter cytoplasmic regions.
2. **Panel (b)**: Coarse segmentation overlaying panel (a), with irregular purple blocks indicating initial region detection.
3. **Panel (c)**: More uniform purple regions with reduced background noise compared to (b), suggesting morphological refinement.
4. **Panel (d)**: Gradual transition to grayscale-like intensity variations within purple regions, possibly representing feature weighting or density analysis.
5. **Panel (e)**: Highly abstracted pattern with sparse purple dots on black background, likely representing key feature localization or quantification.
### Key Observations
- Progressive reduction in spatial resolution from (a) to (e), consistent with feature extraction pipelines.
- Color intensity in purple regions decreases from (a) to (e), potentially indicating feature importance weighting.
- No explicit scale bars, measurement units, or numerical annotations present in any panel.
### Interpretation
This visualization demonstrates a typical image analysis workflow for biomedical research:
1. **Original Data**: Panel (a) provides the raw histological context.
2. **Segmentation**: Panels (b)-(c) show iterative refinement of region detection, likely using thresholding or edge detection algorithms.
3. **Feature Analysis**: Panels (d)-(e) represent dimensionality reduction or feature prioritization, common in machine learning pipelines for pathology.
The absence of quantitative metrics suggests this is a qualitative demonstration of processing stages rather than a quantitative analysis. The purple-to-black gradient across panels may indicate either algorithmic confidence scores or feature saliency maps, though this requires additional context for precise interpretation.