# Technical Document Extraction: Hallucination and Association Analysis
## 1. Image Overview
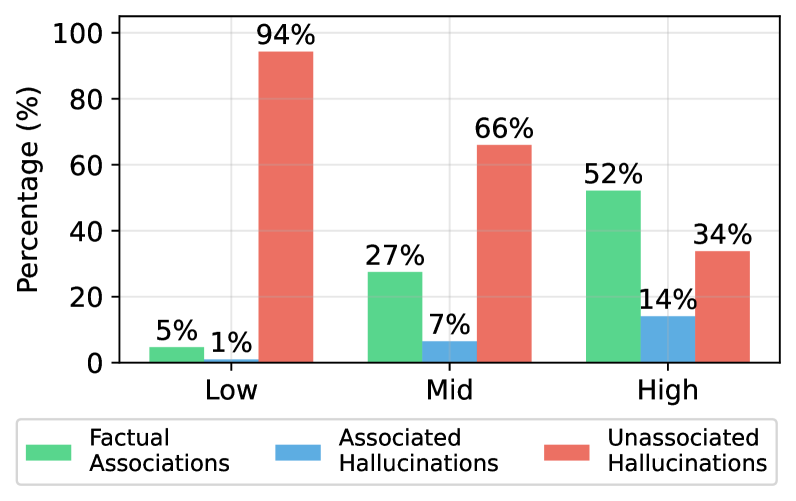
This image is a grouped bar chart illustrating the relationship between three categories of data—**Factual Associations**, **Associated Hallucinations**, and **Unassociated Hallucinations**—across three distinct levels of a variable labeled as **Low**, **Mid**, and **High**.
## 2. Component Isolation
### A. Header / Title
* No explicit title is present within the image frame.
### B. Main Chart Area
* **Y-Axis Label:** Percentage (%)
* **Y-Axis Scale:** 0 to 100, with major tick marks every 20 units (0, 20, 40, 60, 80, 100).
* **X-Axis Categories:** Low, Mid, High.
* **Grid:** Light gray horizontal and vertical grid lines are present.
* **Data Labels:** Numerical percentages are printed directly above each bar for precision.
### C. Legend (Footer)
* **Location:** Bottom center of the image.
* **Green (Hex approx #58D68D):** Factual Associations
* **Blue (Hex approx #5DADE2):** Associated Hallucinations
* **Red/Salmon (Hex approx #EC7063):** Unassociated Hallucinations
---
## 3. Data Table Reconstruction
| Category (X-Axis) | Factual Associations (Green) | Associated Hallucinations (Blue) | Unassociated Hallucinations (Red) |
| :--- | :---: | :---: | :---: |
| **Low** | 5% | 1% | 94% |
| **Mid** | 27% | 7% | 66% |
| **High** | 52% | 14% | 34% |
---
## 4. Trend Verification and Analysis
### Series 1: Factual Associations (Green)
* **Visual Trend:** Slopes upward significantly from left to right.
* **Description:** As the level moves from Low to High, Factual Associations increase more than tenfold, starting at a negligible 5% and reaching a majority share of 52%.
### Series 2: Associated Hallucinations (Blue)
* **Visual Trend:** Slopes upward gradually.
* **Description:** This series represents the smallest portion of the data in all categories but shows a consistent upward trend, increasing from 1% at the Low level to 14% at the High level.
### Series 3: Unassociated Hallucinations (Red)
* **Visual Trend:** Slopes downward sharply.
* **Description:** This series dominates the "Low" category at 94%. However, it decreases steadily as the level increases, dropping to 66% at Mid and further to 34% at High.
---
## 5. Key Findings
* **Inverse Correlation:** There is a clear inverse relationship between "Factual Associations" and "Unassociated Hallucinations." As one increases, the other decreases.
* **Dominance Shift:** At the **Low** level, Unassociated Hallucinations are the overwhelming majority (94%). By the **High** level, Factual Associations become the primary category (52%), though Unassociated Hallucinations still maintain a significant presence (34%).
* **Hallucination Types:** "Unassociated Hallucinations" are consistently more prevalent than "Associated Hallucinations" across all three measured levels, though the gap narrows significantly at the "High" level.