\n
## Bar Chart: Hallucination Rates by Factual Association Level
### Overview
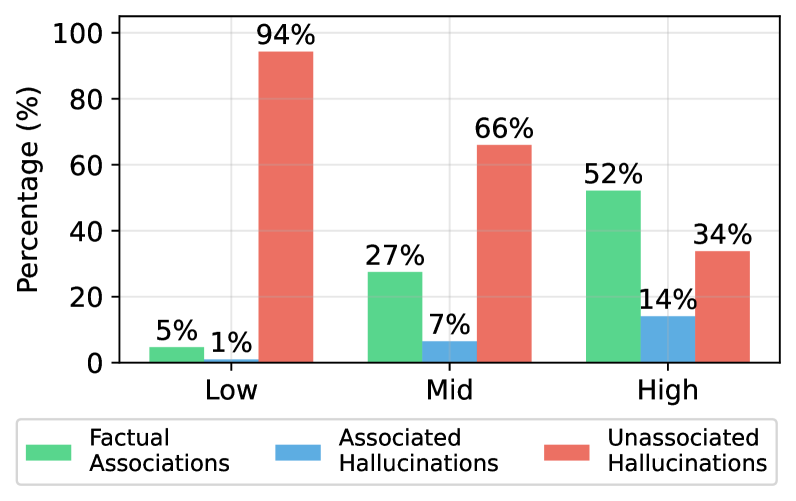
This bar chart illustrates the percentage of hallucinations (categorized as "Associated Hallucinations" and "Unassociated Hallucinations") and "Factual Associations" across three levels: "Low", "Mid", and "High". The y-axis represents the percentage, ranging from 0% to 100%. The x-axis represents the level of factual association.
### Components/Axes
* **X-axis:** "Factual Associations" with categories: "Low", "Mid", "High".
* **Y-axis:** "Percentage (%)", ranging from 0 to 100, with increments of 10.
* **Legend:** Located at the bottom of the chart, identifying the three data series:
* "Factual Associations" - represented by a light green color.
* "Associated Hallucinations" - represented by a light blue color.
* "Unassociated Hallucinations" - represented by a salmon/red color.
### Detailed Analysis
The chart consists of three groups of bars, one for each level of factual association ("Low", "Mid", "High"). Within each group, there are three bars representing the percentage of Factual Associations, Associated Hallucinations, and Unassociated Hallucinations.
* **Low:**
* Factual Associations: Approximately 5% (green bar).
* Associated Hallucinations: Approximately 1% (blue bar).
* Unassociated Hallucinations: Approximately 94% (red bar).
* **Mid:**
* Factual Associations: Approximately 27% (green bar).
* Associated Hallucinations: Approximately 7% (blue bar).
* Unassociated Hallucinations: Approximately 66% (red bar).
* **High:**
* Factual Associations: Approximately 52% (green bar).
* Associated Hallucinations: Approximately 14% (blue bar).
* Unassociated Hallucinations: Approximately 34% (red bar).
The "Unassociated Hallucinations" bar dominates at the "Low" level, decreasing as the level of factual association increases. The "Factual Associations" bar increases steadily from "Low" to "High". The "Associated Hallucinations" bar also increases as the level of factual association increases, but remains significantly lower than the other two categories.
### Key Observations
* At the "Low" level of factual association, unassociated hallucinations are overwhelmingly dominant (94%).
* As the level of factual association increases, the percentage of unassociated hallucinations decreases, while the percentage of factual associations increases.
* Associated hallucinations remain a relatively small percentage across all levels, but increase with higher factual association.
* The sum of the percentages for each level does not equal 100%, suggesting that there may be other categories not represented in the chart.
### Interpretation
The data suggests a strong inverse relationship between the level of factual association and the occurrence of unassociated hallucinations. This implies that as the grounding in factual information increases, the likelihood of experiencing hallucinations that are not tied to reality decreases. The increase in associated hallucinations with higher factual association could indicate that hallucinations become more complex and potentially linked to existing knowledge or memories as factual grounding improves. The chart highlights the importance of factual grounding in mitigating the risk of unassociated hallucinations. The fact that the percentages do not sum to 100% suggests that there are other types of hallucinations or states of consciousness not captured by this categorization. This data could be relevant to understanding and treating conditions involving hallucinations, such as schizophrenia or other psychotic disorders.