## Bar Chart: Distribution of Associations and Hallucinations by Category
### Overview
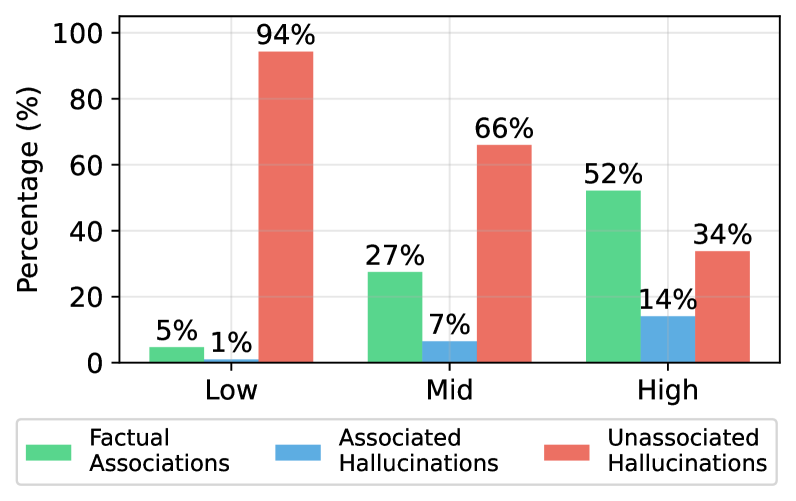
The chart displays the percentage distribution of three categories ("Low," "Mid," "High") across three data series: Factual Associations (green), Associated Hallucinations (blue), and Unassociated Hallucinations (red). Each category shows distinct patterns in the dominance of these series.
### Components/Axes
- **X-axis**: Categories labeled "Low," "Mid," "High" (left to right).
- **Y-axis**: Percentage (%) ranging from 0% to 100% in 20% increments.
- **Legend**: Located at the bottom, with color coding:
- Green: Factual Associations
- Blue: Associated Hallucinations
- Red: Unassociated Hallucinations
- **Bar Structure**: Grouped bars for each category, with percentages labeled on top of each bar.
### Detailed Analysis
1. **Low Category**:
- Factual Associations: 5% (green bar, shortest).
- Associated Hallucinations: 1% (blue bar, barely visible).
- Unassociated Hallucinations: 94% (red bar, tallest).
2. **Mid Category**:
- Factual Associations: 27% (green bar, medium height).
- Associated Hallucinations: 7% (blue bar, shorter than green).
- Unassociated Hallucinations: 66% (red bar, tallest but shorter than in "Low").
3. **High Category**:
- Factual Associations: 52% (green bar, tallest).
- Associated Hallucinations: 14% (blue bar, shorter than green).
- Unassociated Hallucinations: 34% (red bar, shortest in this category).
### Key Observations
- **Dominance Shifts**: Unassociated Hallucinations dominate in "Low" (94%) but decrease significantly in "High" (34%). Factual Associations grow from 5% ("Low") to 52% ("High").
- **Associated Hallucinations**: Consistently the smallest across all categories (1% → 7% → 14%), showing a slight upward trend but remaining minor.
- **Color Consistency**: Legend colors match bar colors exactly (green = Factual, blue = Associated, red = Unassociated).
### Interpretation
The data suggests a correlation between category severity ("Low" to "High") and the prevalence of factual associations versus hallucinations. As categories increase:
1. **Factual Associations** become more dominant, indicating higher reliability or accuracy in higher categories.
2. **Unassociated Hallucinations** decrease sharply, implying reduced errors or irrelevant associations in "High" categories.
3. **Associated Hallucinations** remain low but increase slightly, possibly reflecting minor contextual errors that grow marginally with category complexity.
This pattern could indicate that higher-confidence systems or classifications (e.g., "High" category) prioritize factual accuracy while minimizing hallucinations, though associated errors persist at a low level. The stark drop in unassociated hallucinations from "Low" to "High" highlights the importance of category refinement in reducing noise.