## Network Diagram: Complex Interconnections
### Overview
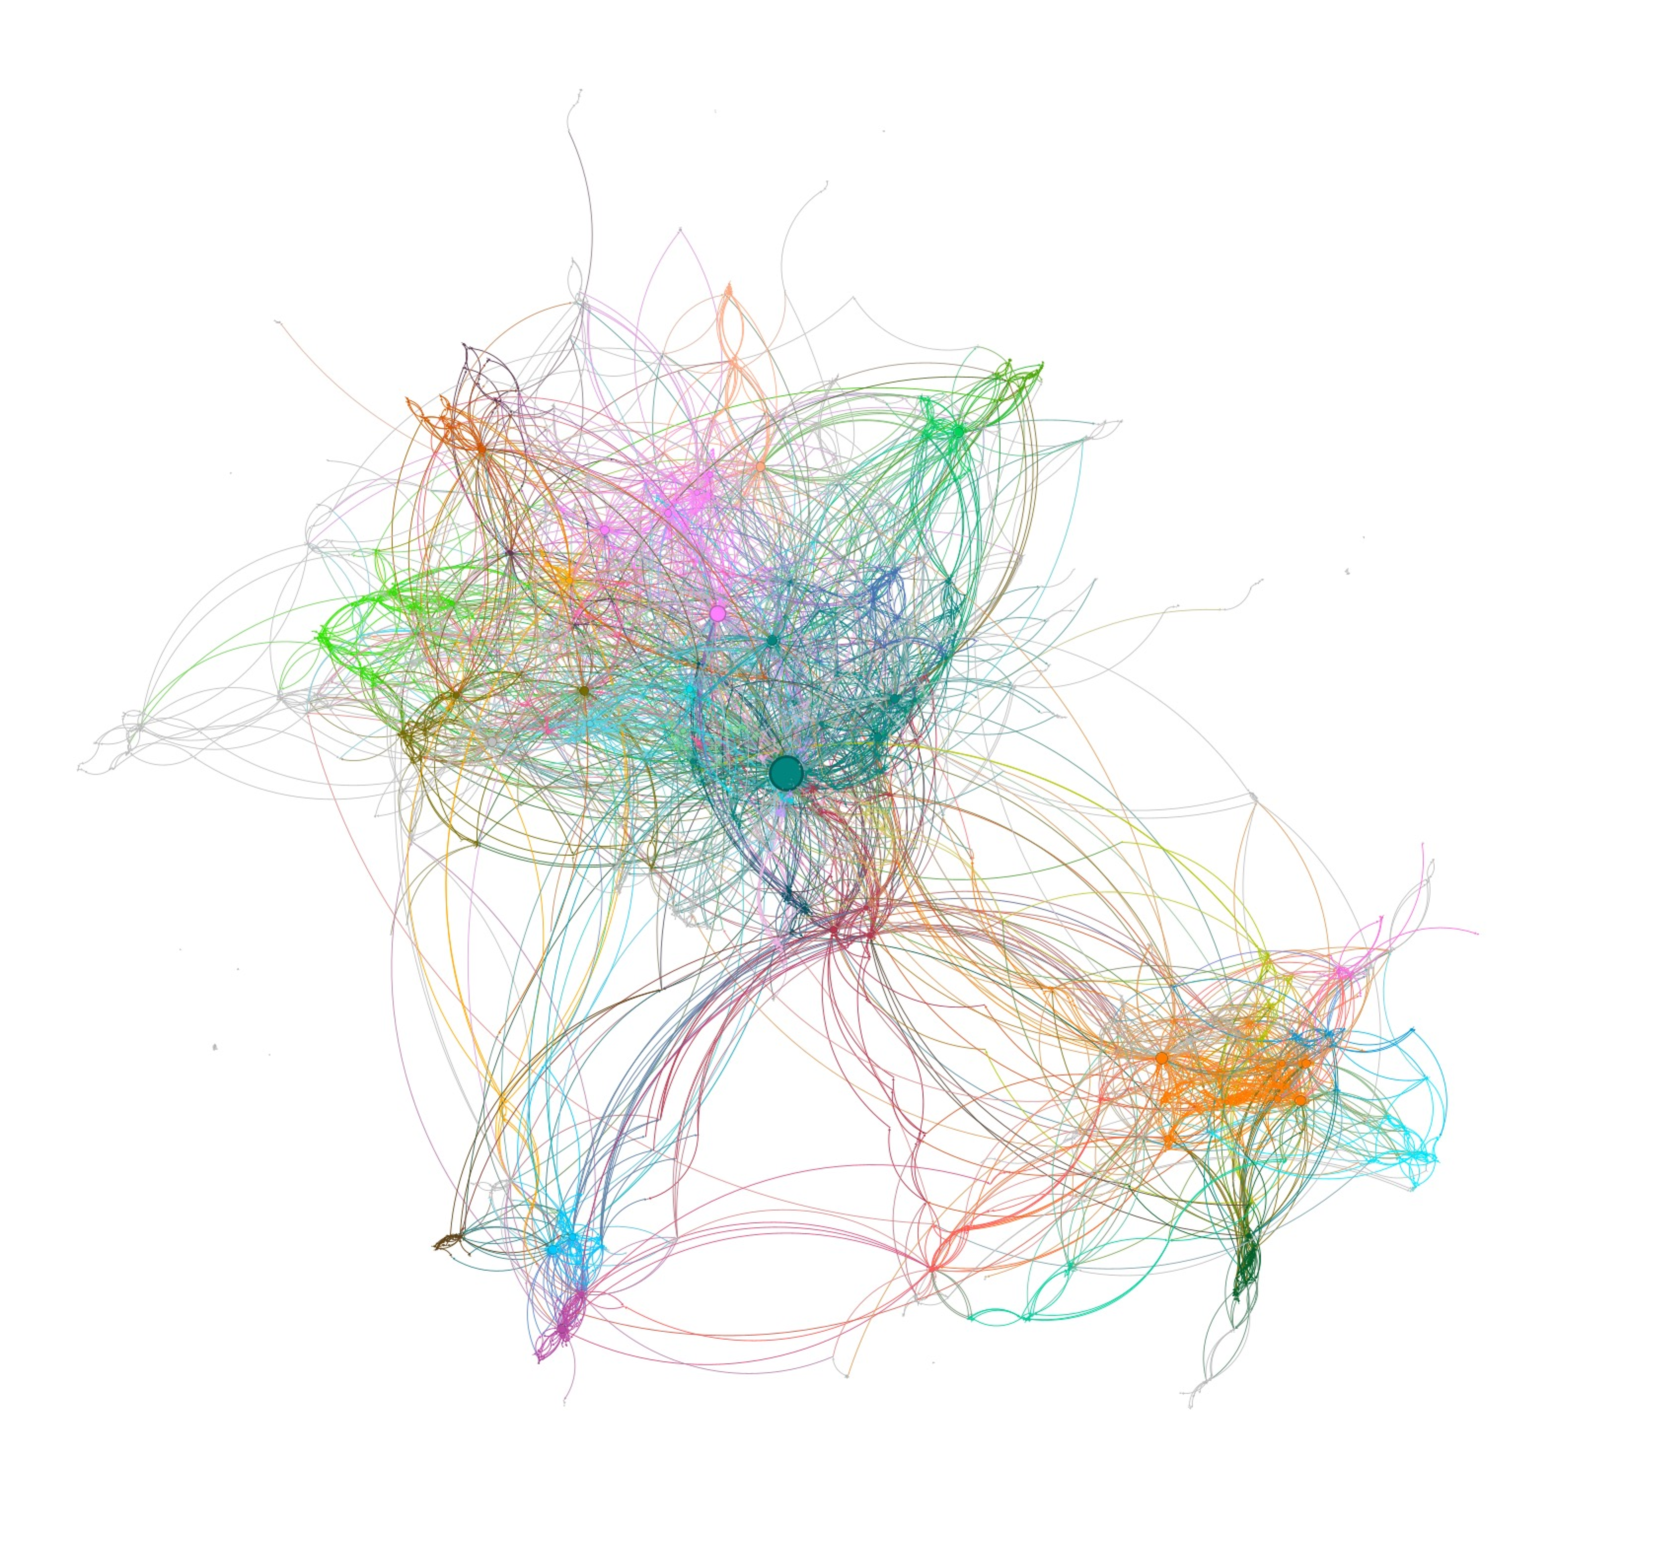
The image is a network diagram displaying complex interconnections between numerous nodes. The nodes are represented by small, colored circles, and the connections between them are shown as curved lines of corresponding colors. The diagram exhibits a high degree of interconnectedness, with several clusters of nodes and a central hub.
### Components/Axes
* **Nodes:** Represented by small circles of various colors (e.g., green, pink, orange, blue, teal, gray).
* **Edges:** Represented by curved lines connecting the nodes, with colors matching the nodes they connect.
* **Central Hub:** A larger teal-colored node located near the center of the diagram, acting as a major point of convergence for many connections.
* **Clusters:** Several distinct clusters of nodes are visible, each characterized by a dominant color and a high density of connections within the cluster.
### Detailed Analysis
* **Node Distribution:** The nodes are not uniformly distributed. They are concentrated in several distinct clusters, with a higher density of nodes near the center of the diagram.
* **Edge Density:** The density of edges varies across the diagram. It is highest within the clusters and near the central hub, indicating a high degree of interaction between the nodes in these regions.
* **Color Distribution:** The colors of the nodes and edges appear to be distributed non-randomly, with certain colors being more prevalent in specific clusters.
* **Central Hub:** The central hub is teal, with many teal connections emanating from it.
* **Top-Left Cluster:** A cluster in the top-left region is predominantly green.
* **Top Cluster:** A cluster at the top is predominantly pink.
* **Bottom-Right Cluster:** A cluster in the bottom-right region is predominantly orange.
* **Bottom-Left Cluster:** A cluster in the bottom-left region is predominantly blue.
* **Edge Curvature:** The edges are curved, suggesting a non-linear relationship or interaction between the connected nodes. The curvature also adds to the visual complexity of the diagram.
### Key Observations
* **Centralization:** The presence of a central hub suggests a hierarchical structure or a central point of control within the network.
* **Clustering:** The distinct clusters indicate the presence of communities or groups of nodes that are more closely related to each other than to the rest of the network.
* **Color Coding:** The use of color coding suggests that the nodes and edges are categorized or classified based on some underlying attribute or property.
### Interpretation
The network diagram likely represents a complex system with multiple interacting components. The central hub may represent a key entity or process that influences the behavior of the entire system. The clusters may represent distinct functional modules or groups of related entities. The color coding may represent different types of entities, relationships, or activities within the system. Without additional context, it is difficult to determine the specific meaning of the nodes, edges, and colors. However, the diagram provides a visual representation of the system's structure and connectivity, which can be used to gain insights into its behavior and dynamics. The high degree of interconnectedness suggests that the system is highly resilient and adaptable, but also potentially vulnerable to cascading failures or disruptions.