## Network Graph: Abstract Connectivity Topology
### Overview
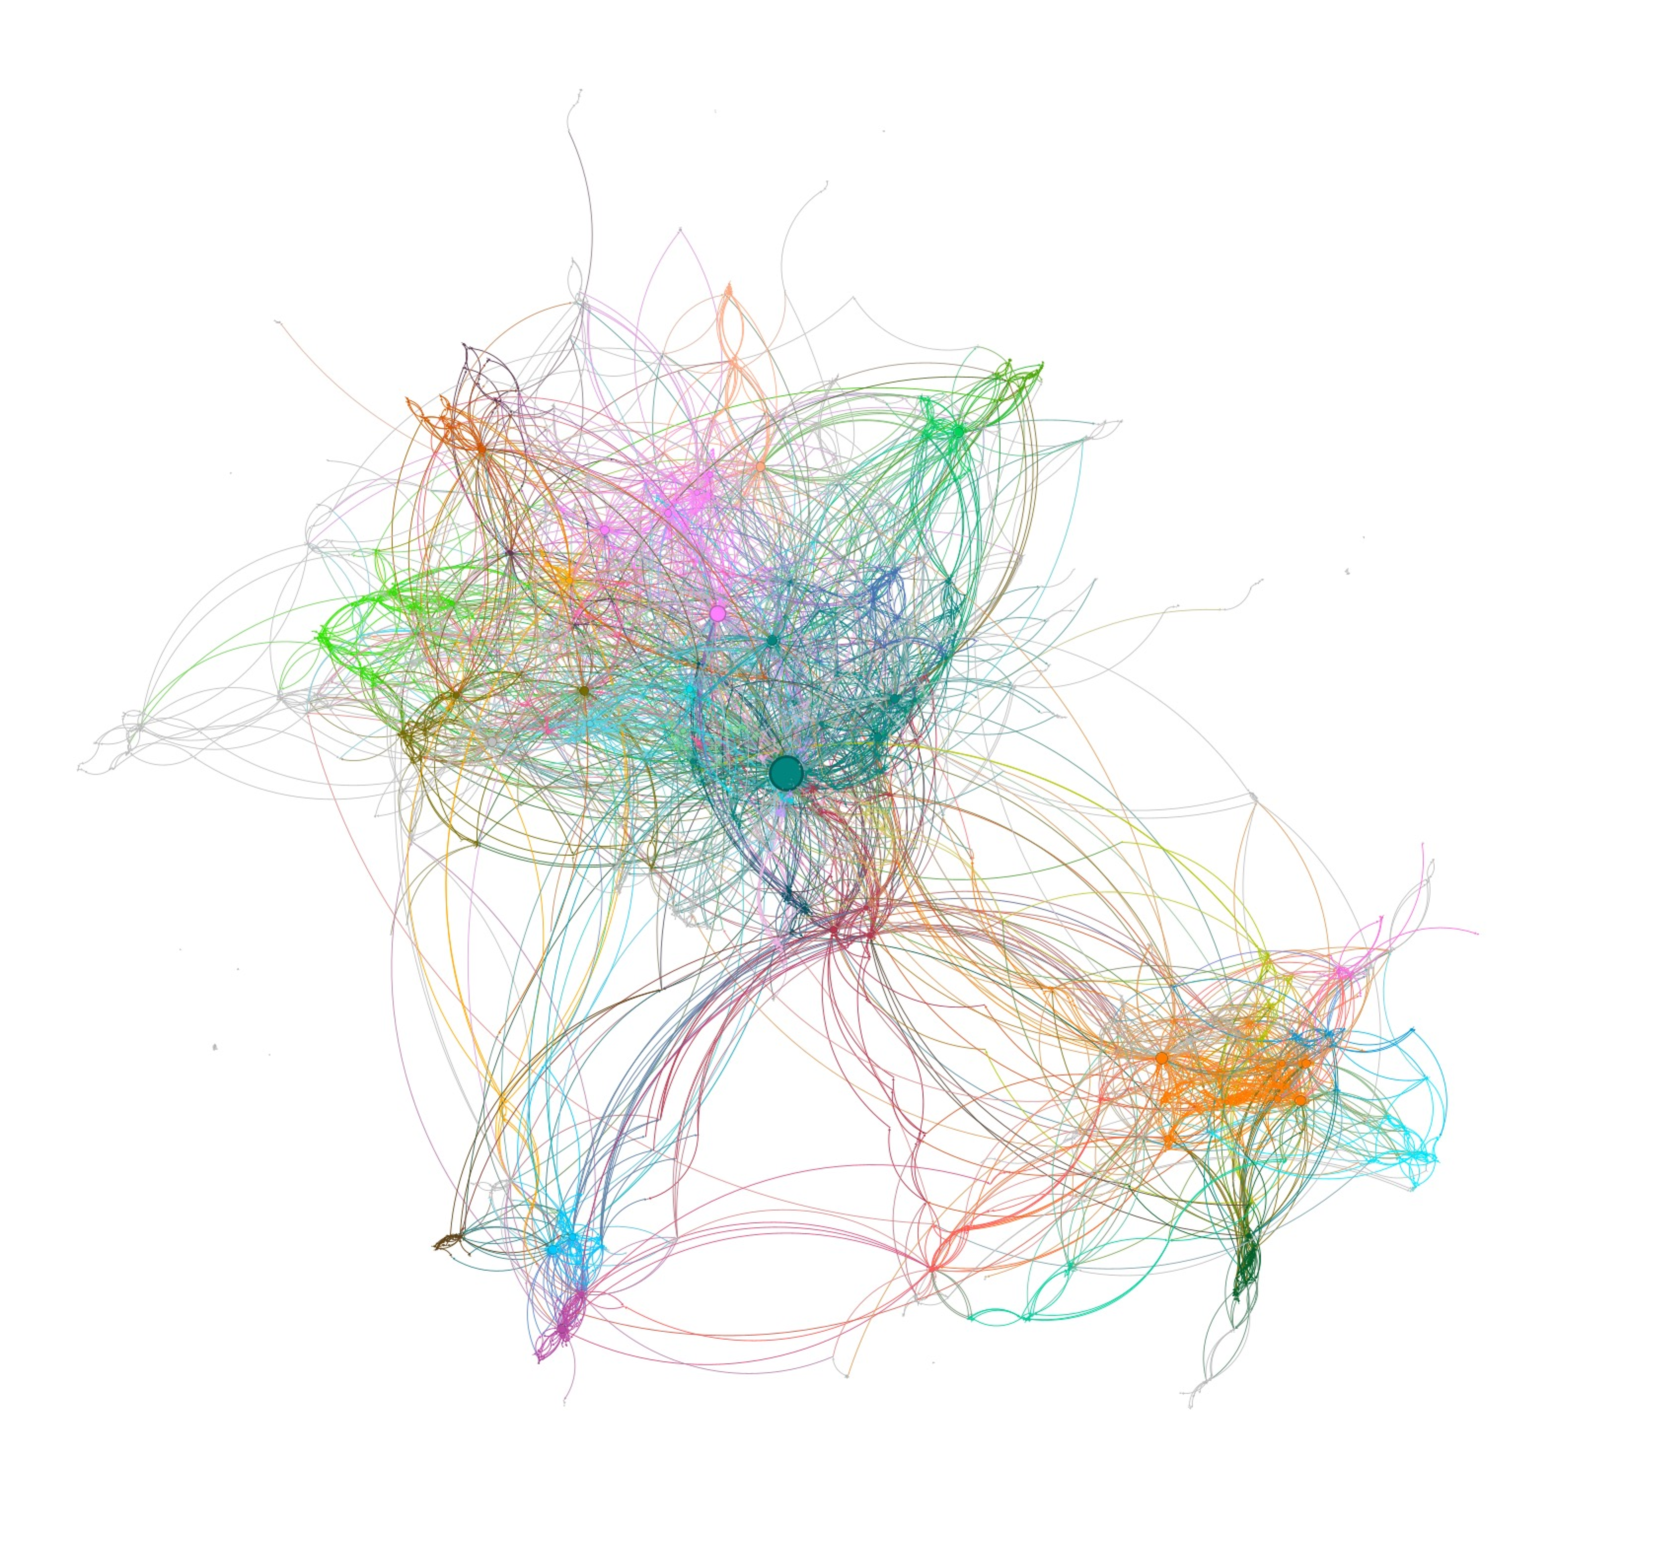
This image is a force-directed network graph visualization. It displays a complex system of interconnected nodes (represented by dots) and edges (represented by lines). The graph is devoid of any textual labels, axis markers, or legends, indicating that this is a structural visualization of relationships rather than a quantitative chart with defined units. The layout suggests a "small-world" network structure, characterized by distinct clusters and high-centrality hubs.
### Components
* **Nodes:** Circular points of varying sizes. The size of the node generally correlates with its "degree" (the number of connections it has).
* **Edges:** Thin, curved lines connecting the nodes. The density of these lines indicates the strength or frequency of interaction between nodes.
* **Coloring:** A multi-colored spectrum (ranging from red, orange, yellow, green, blue, to purple and teal) is applied to the nodes and edges. This is typically used in network analysis software (like Gephi) to represent "modularity classes" or distinct communities within the network.
* **Layout:** A force-directed algorithm, where nodes with many connections are pulled toward the center, and nodes with fewer connections are pushed to the periphery.
### Detailed Analysis
The graph is spatially organized into two primary regions of high density, connected by a central bridge.
**1. The Central Hub (Center-Left):**
* **Position:** Located slightly to the left of the geometric center.
* **Feature:** A single, large, teal-colored node acts as the primary anchor for the entire graph.
* **Connectivity:** This node has the highest visual degree of connectivity, with a vast number of edges radiating outward to almost every other cluster in the graph. It functions as a "bridge" or "bottleneck" between the upper-left and lower-right sections.
**2. The Upper-Left Cluster:**
* **Position:** Occupies the top-left quadrant.
* **Composition:** This is a highly heterogeneous region with a mix of green, blue, pink, and purple nodes.
* **Trend:** The edges here are highly entangled, suggesting a high degree of local clustering (high clustering coefficient). There is significant overlap, making individual node identification difficult.
**3. The Lower-Right Cluster:**
* **Position:** Occupies the bottom-right quadrant.
* **Composition:** This cluster is more distinct and visually separated from the upper-left group. It is dominated by orange, yellow, and light-blue nodes.
* **Trend:** This cluster appears more "tightly knit" internally, with a high density of short-range edges, suggesting a cohesive community or sub-group that interacts frequently within itself but relies on the central teal hub to connect to the rest of the network.
### Key Observations
* **Scale-Free Property:** The graph exhibits a power-law distribution. A few nodes (like the central teal one) have a disproportionately high number of connections, while the vast majority of nodes have very few connections.
* **Modularity:** The clear color-coding indicates that the network is composed of distinct communities. The orange/yellow community (bottom-right) is clearly separated from the green/blue/pink community (top-left).
* **Bridge Nodes:** Aside from the main teal hub, there are several smaller nodes that act as secondary bridges, creating long-range connections between the two main clusters.
### Interpretation
This visualization represents a **relational network**. Without specific labels, it is impossible to identify the entities (e.g., people, websites, biological proteins, or financial transactions), but the structural properties are clear:
1. **Information/Flow Bottleneck:** The large teal node is the most critical component. If this node were removed, the network would likely fragment into two or more disconnected components. It represents a single point of failure or a primary gatekeeper.
2. **Community Structure:** The distinct color-coding suggests that the system is not a random network but one with "homophily"—the tendency of similar nodes to connect to one another. The bottom-right cluster represents a specific sub-group that is internally cohesive but structurally isolated from the upper-left group.
3. **System Dynamics:** This type of graph is commonly used in social network analysis (to show influence), cybersecurity (to show network traffic patterns), or bioinformatics (to show protein-protein interactions). The visual "messiness" in the center indicates high-traffic interaction, while the cleaner edges at the periphery indicate more specialized or peripheral relationships.
**Note:** This image contains **zero textual information**. All analysis is derived from the topological structure and visual density of the nodes and edges.