## Network Graph Diagram: Complex Node-Link Visualization
### Overview
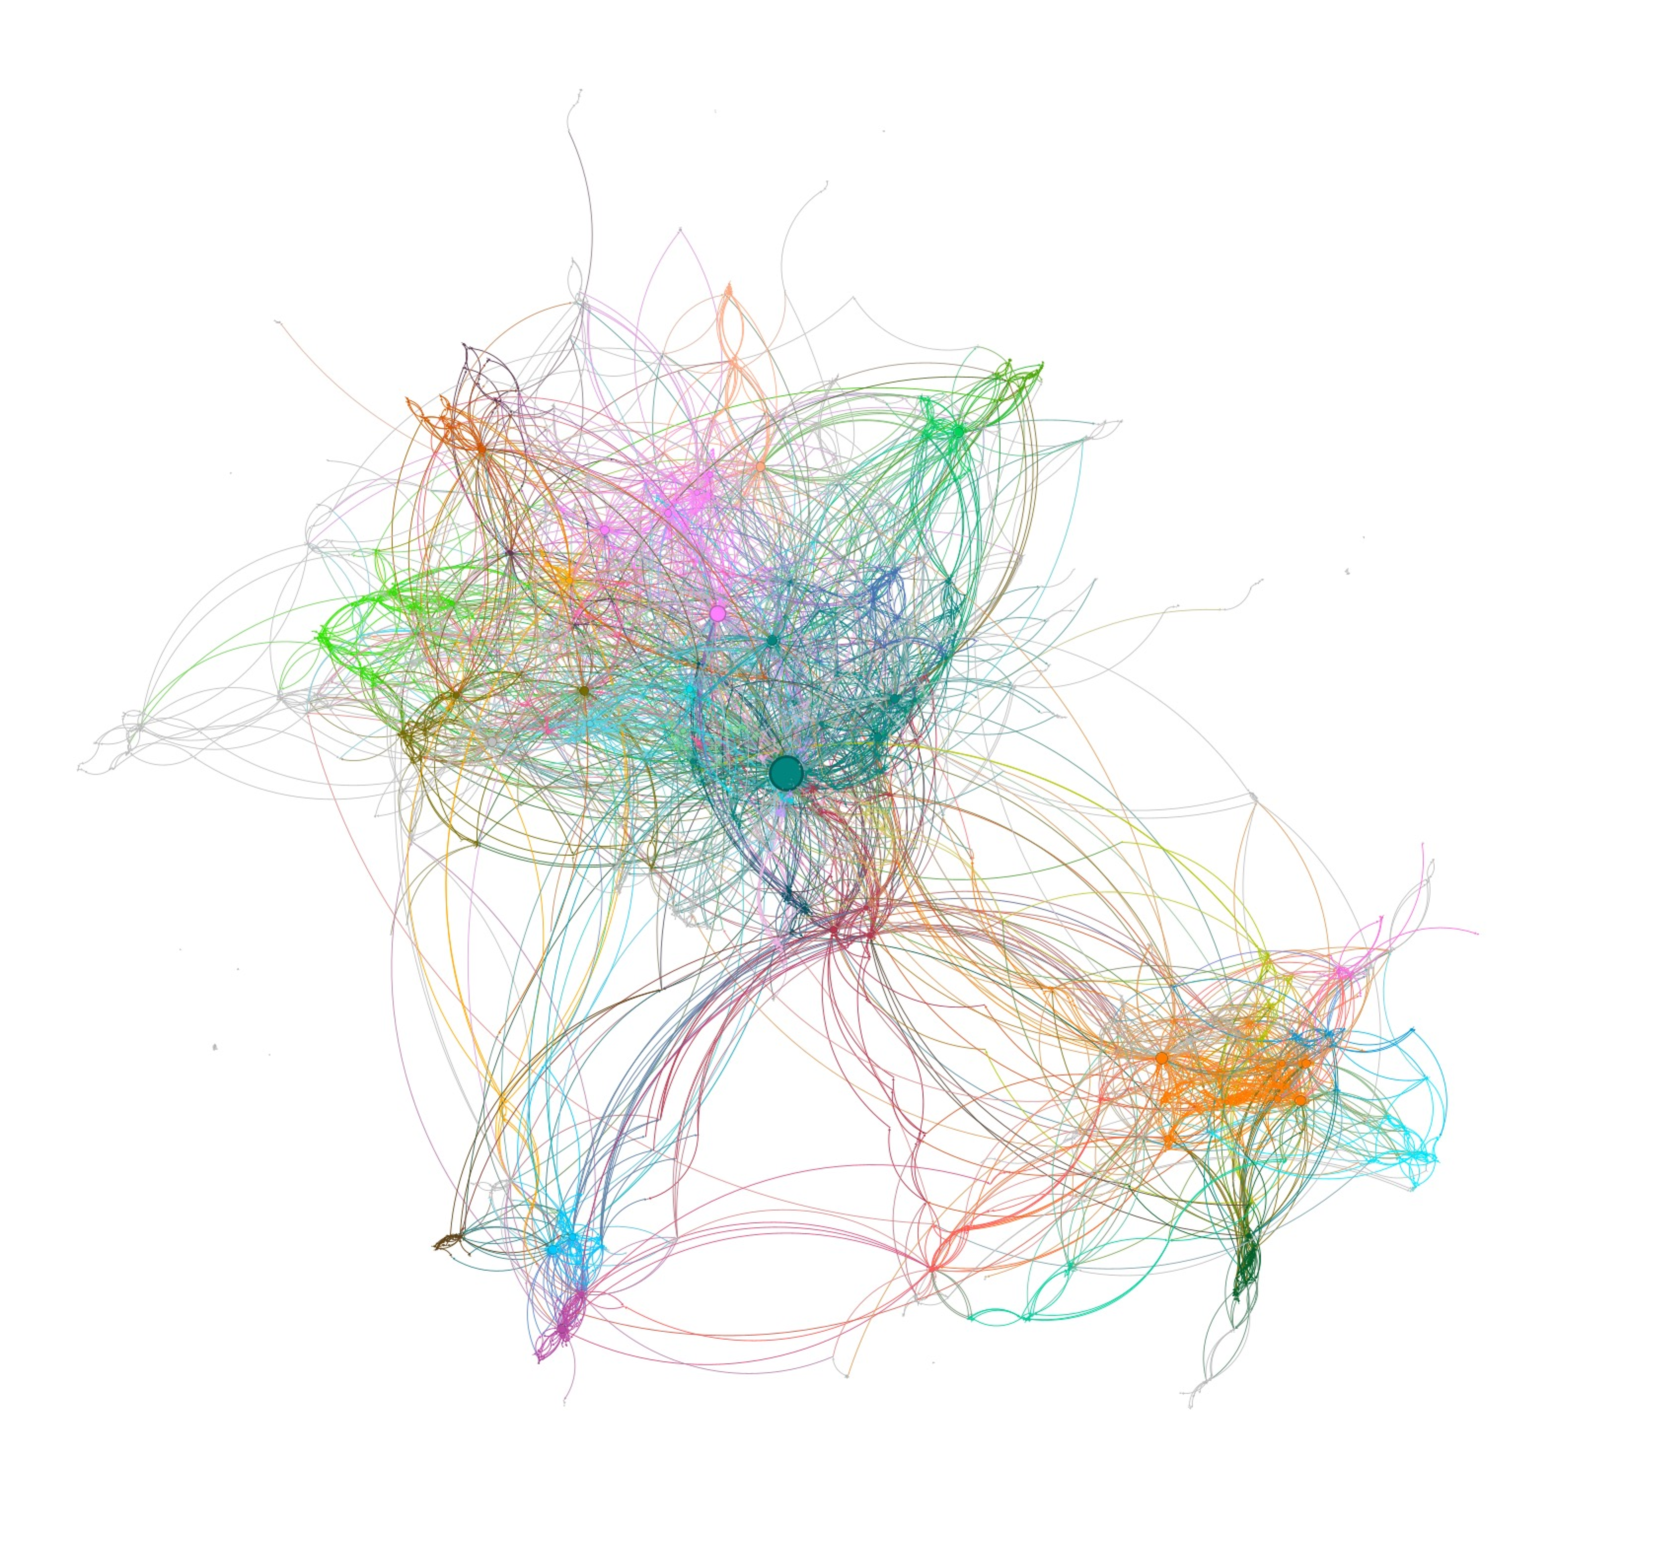
The image displays a complex, unlabelled network graph (specifically a node-link diagram) rendered against a solid white background. It visualizes the relationships and clustering of numerous entities. The visualization relies entirely on color, node size, edge density, and spatial positioning to convey information.
**CRITICAL NOTE:** There is absolutely no text, typography, labels, axes, legends, or numerical data present in this image. The data extracted below is based entirely on the visual topology and structural properties of the rendered network.
### Components/Axes
* **Text/Labels:** None present.
* **Axes/Scales:** None present. The spatial distribution appears to be generated by a force-directed layout algorithm (such as Fruchterman-Reingold or ForceAtlas2), where proximity indicates relationship strength or community belonging rather than Cartesian coordinates.
* **Nodes (Vertices):** Represented by solid circles.
* *Size:* Varies significantly, indicating a metric like "Degree Centrality" (number of connections) or "Betweenness Centrality."
* *Color:* Indicates community detection or modularity class (groupings of similar nodes).
* **Edges (Links):** Represented by thin, curved lines connecting the nodes.
* *Color:* Edges generally inherit the color of the nodes they connect, blending or transitioning when connecting different colored clusters.
* *Shape:* Highly curved, sweeping arcs, which helps distinguish individual connections in dense areas.
### Detailed Analysis (Spatial & Structural)
To analyze the data structure, the image can be segmented into distinct spatial regions based on clustering:
**1. The Central Hub (Center / Slightly Right)**
* **Visual Trend:** All major pathways in the graph eventually route through or near this area.
* **Key Feature:** Contains the single largest node in the entire network. It is colored dark teal/blue-green.
* **Connections:** This central node has an extremely high degree of connectivity, with edges radiating outward 360 degrees to almost every other color cluster in the graph.
**2. The Upper-Left Mass (Top-Left to Center-Left)**
* **Visual Trend:** This is the most densely packed region of the graph, forming a large, interconnected "cloud."
* **Colors Present:** A highly mixed palette including bright green, pink/magenta, light blue, orange, and pale yellow.
* **Structure:** While dense, there are distinct sub-centers (slightly larger nodes in pink and green) acting as local hubs within this larger mass.
**3. The Bottom-Right Peninsula (Bottom-Right)**
* **Visual Trend:** A distinct, somewhat isolated cluster that forms its own sub-network, pulled away from the main mass.
* **Colors Present:** Predominantly bright orange and cyan/light blue, with a small dark green cluster at the very bottom tip.
* **Connections:** It is connected to the central hub and upper mass via long, sweeping, distinct edge bundles. These "bridge" edges are primarily colored red, pink, and brown, indicating the specific pathways that link this isolated community to the rest of the network.
**4. The Bottom-Left Lobe (Bottom-Left)**
* **Visual Trend:** A smaller, looser grouping of nodes.
* **Colors Present:** Primarily blue, purple, and brown.
* **Connections:** Features long, looping connections that tie back into the central teal hub and the lower portions of the upper-left mass.
**5. The Periphery (Outer Edges)**
* **Visual Trend:** Sparse, wispy connections extending outward into the white space.
* **Structure:** Composed of very small nodes with only one or two connections (degree of 1 or 2). The edges here are often grey or very pale, indicating weak ties or outlier data points.
### Key Observations
* **Extreme Centralization:** The network is heavily reliant on the single dark teal node. If this were a vulnerability map, that node represents a single point of failure.
* **Strong Modularity:** Despite the central hub, the network has distinct communities (represented by colors). The force-directed layout successfully pulls these communities apart, most notably the bottom-right orange/cyan cluster.
* **Bridge Connections:** The long red/pink arcs connecting the bottom-right cluster to the center are crucial; they represent the few entities that bridge the gap between two otherwise isolated communities.
### Interpretation
While the specific subject matter (e.g., social media interactions, biological protein pathways, IT infrastructure, or semantic word associations) is unknown due to the lack of labels, the *behavior* of the data is clear.
The data demonstrates a **"Scale-Free" or "Hub-and-Spoke" network topology** mixed with strong community structures.
1. **The "Who/What":** There is one dominant entity (the teal node) that interacts with almost everything.
2. **The Communities:** The entities naturally form echo-chambers or specialized groups (the distinct color clusters). For example, the orange nodes in the bottom right interact heavily with each other, but rarely interact directly with the green nodes in the top left; they must route their relationship through the central hubs or the specific red/pink bridge connections.
3. **Reading between the lines:** The presence of the isolated bottom-right cluster suggests a sub-group that is fundamentally different or geographically/logically separated from the main body of data, yet still tethered to the overall ecosystem by a few key links.