## Network Diagram: Complex Multi-Cluster Graph
### Overview
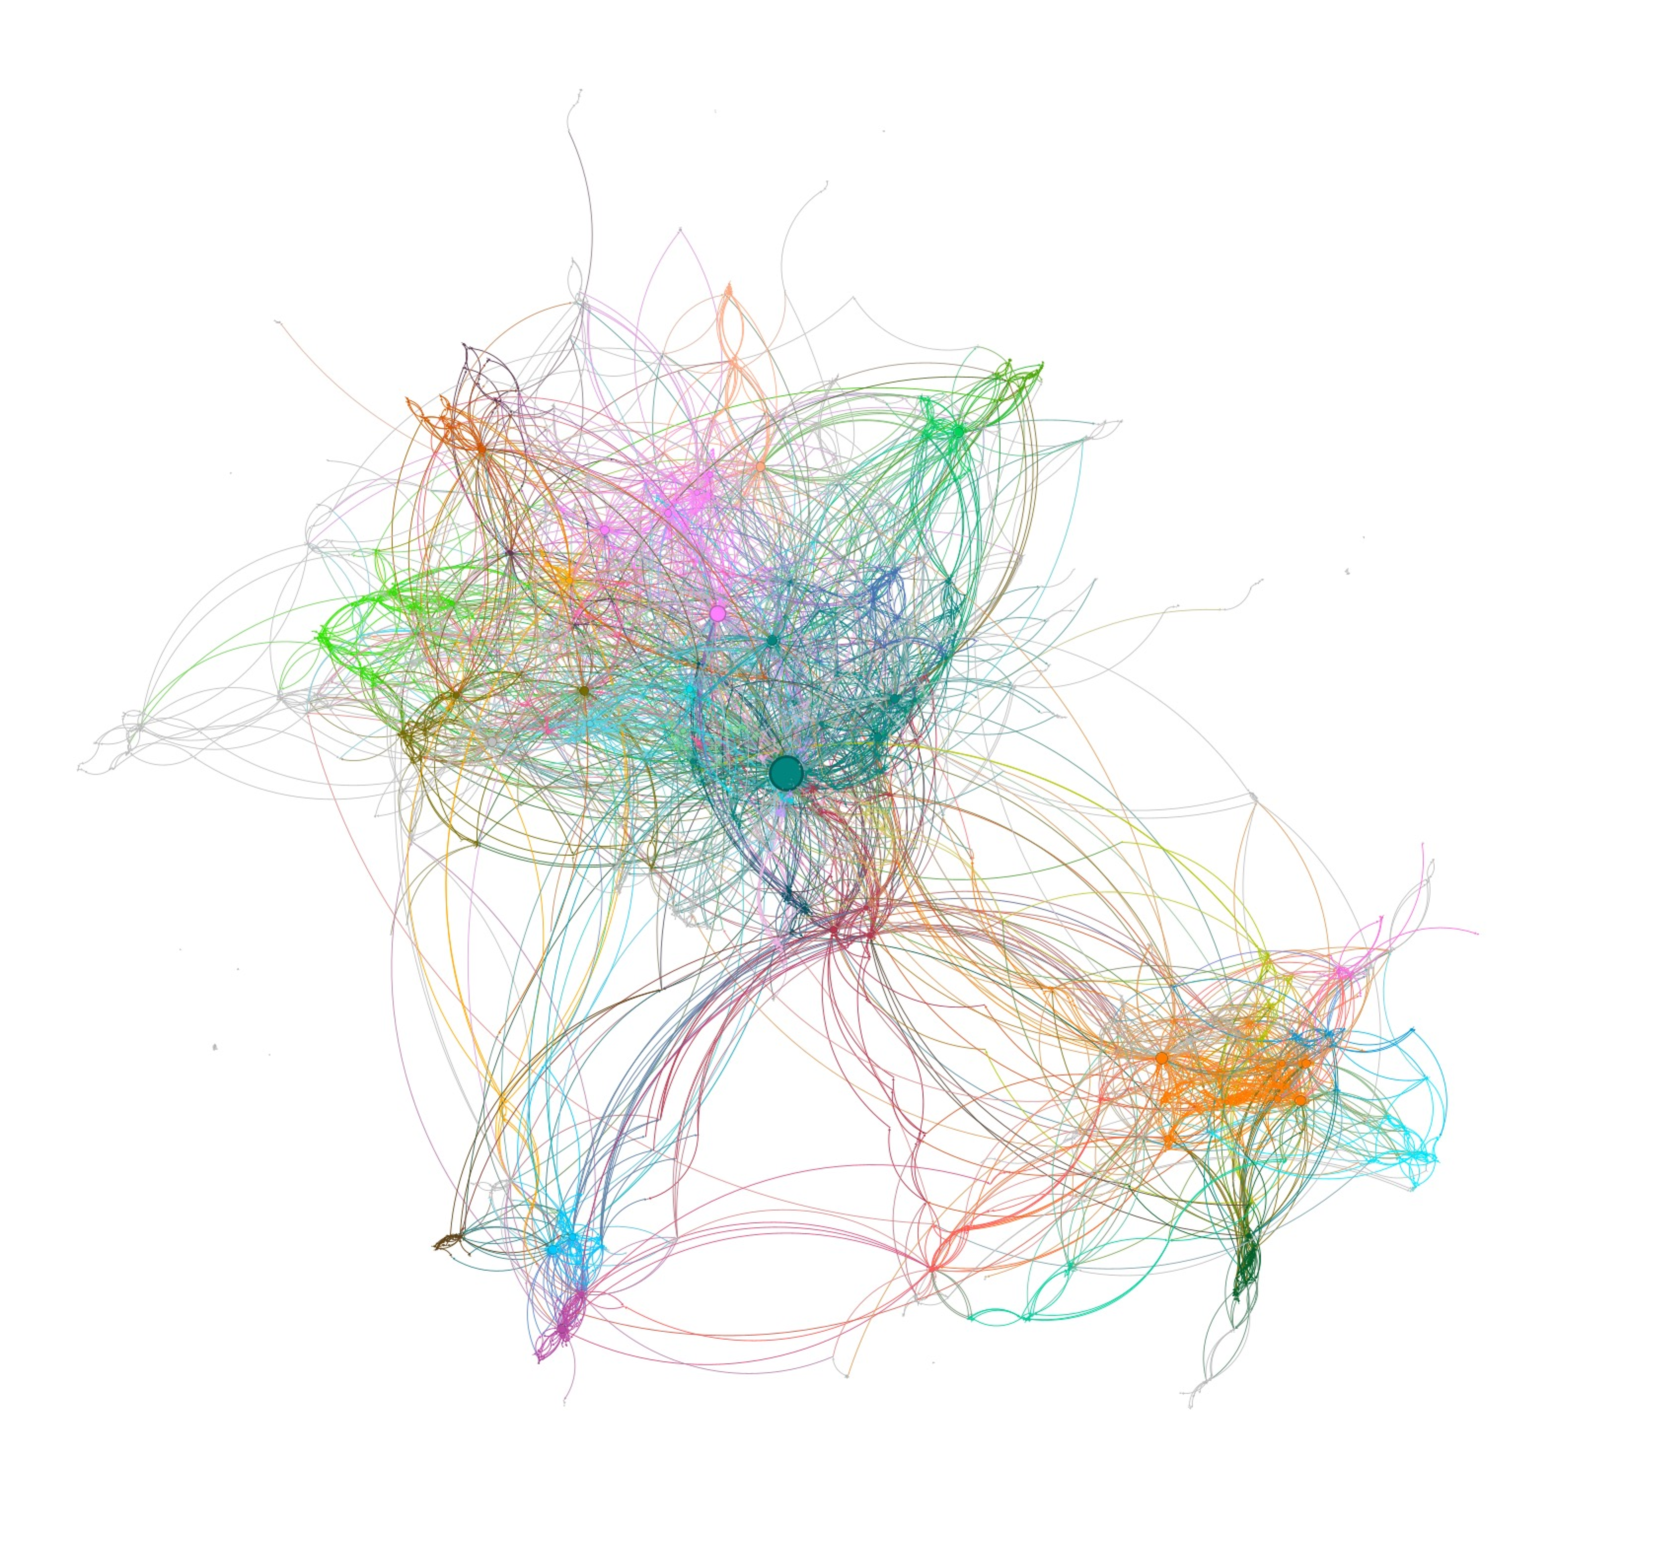
The image displays a complex, force-directed network graph or node-link diagram on a plain white background. It consists of numerous nodes (points) connected by curved edges (lines). The graph exhibits a clear community structure, with several dense clusters of nodes interconnected by sparser, longer-range links. There is no textual information, labels, axis titles, legends, or numerical data present in the image.
### Components/Axes
* **Nodes:** Represented as small dots. Their size appears relatively uniform, with one notably larger, dark teal node located near the center of the largest cluster. Node color varies and seems to correspond to cluster membership.
* **Edges:** Represented as thin, curved lines of varying colors. The color of an edge often matches the color of the nodes it connects, suggesting it may represent the type or strength of connection within a community.
* **Clusters/Communities:** The graph is organized into several distinct, densely interconnected groups:
1. A large, central, and very dense cluster dominated by teal, blue, and purple nodes/edges.
2. A prominent cluster in the upper-left quadrant, characterized by bright green nodes and edges.
3. A cluster in the upper-right area, featuring orange and brown tones.
4. A distinct, somewhat isolated cluster in the lower-right quadrant, primarily orange.
5. A smaller, loose cluster in the lower-left, with pink and blue nodes.
6. Several peripheral, less dense groupings and individual nodes scattered around the main structure.
* **Spatial Layout:** The overall shape is irregular. The largest cluster forms the core. The green cluster extends to the left, the orange/brown cluster to the upper right, and the isolated orange cluster to the lower right. Long, sweeping edges connect these major clusters across the white space.
### Detailed Analysis
* **Trend Verification (Visual):** The diagram does not show trends over time or measured values. Instead, it visualizes relational data. The primary "trend" is the strong tendency for nodes of similar color to be densely connected to each other, forming tight communities.
* **Data Points:** No numerical data points, coordinates, or quantitative values are provided. The information is purely topological and relational.
* **Color-Coding:** The color palette is diverse and appears categorical. Key observed colors include: teal/dark cyan, bright green, orange, brown, purple, pink, blue, and yellow. The large central node is a distinct dark teal.
* **Connectivity Pattern:** Within clusters, connections are extremely dense, creating a tangled, almost solid appearance. Between clusters, connections are fewer and more distinct, acting as bridges. Some nodes on the periphery have only one or two connections.
### Key Observations
1. **Absence of Text:** The image contains zero textual elements—no labels for nodes, no title, no legend explaining the color coding, and no scale or key.
2. **Clear Community Structure:** The most striking feature is the segmentation into color-coded communities. This is the primary information conveyed.
3. **Central Hub:** The single large, dark teal node in the central cluster suggests it may be a hub of high importance or connectivity within that community.
4. **Variable Cluster Density:** The central and green clusters appear most densely interconnected, while the lower-right orange cluster is somewhat more loosely structured.
5. **Long-Range Links:** A few edges span significant distances across the graph, connecting otherwise distant clusters (e.g., from the central cluster to the lower-right orange cluster).
### Interpretation
This diagram is a visualization of a complex network, likely representing one of the following:
* A **social network**, where nodes are individuals and edges are relationships, with colors representing different social circles or communities.
* A **biological network**, such as a protein-protein interaction map or a neural network, where clusters represent functional modules.
* A **information or citation network**, where nodes are documents or concepts, and clusters represent specific topics or fields.
* A **computer network** topology.
**What the data suggests:** The structure strongly indicates a **modular network**. The system is not random; it is composed of tightly-knit subgroups that are themselves interconnected. This is a hallmark of many real-world complex systems. The large central node could be a critical point of failure or a key influencer within its community.
**Notable Anomalies/Limitations:** The complete lack of metadata (labels, legend, title) is the critical limitation. Without this context, the specific meaning of the clusters, the identity of the nodes, and the nature of the connections are entirely unknown. The visualization effectively shows *that* there is structure, but not *what* that structure represents. To derive actionable insight, this graph must be paired with its corresponding key and dataset.