## Line Chart: Accuracy vs. Thinking Compute
### Overview
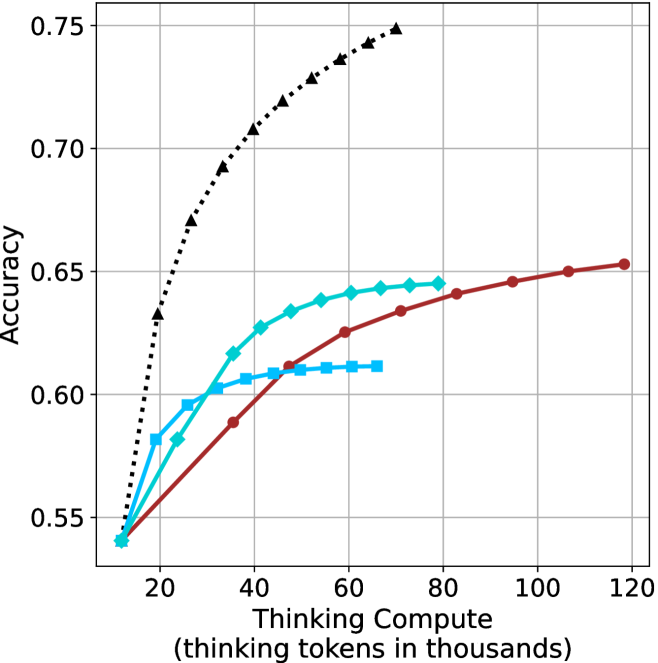
This image presents a line chart illustrating the relationship between "Thinking Compute" (measured in thousands of tokens) and "Accuracy". Four distinct data series are plotted, each represented by a different colored line with distinct markers. The chart appears to demonstrate how accuracy improves with increased computational effort (thinking tokens).
### Components/Axes
* **X-axis:** "Thinking Compute (thinking tokens in thousands)". Scale ranges from approximately 0 to 120, with markers at 20, 40, 60, 80, 100, and 120.
* **Y-axis:** "Accuracy". Scale ranges from approximately 0.55 to 0.75, with markers at 0.55, 0.60, 0.65, 0.70, and 0.75.
* **Data Series:** Four lines are present, each with a unique color and marker style:
* Black dotted line with diamond markers.
* Teal (cyan) line with circular markers.
* Red line with circular markers.
* Blue line with square markers.
### Detailed Analysis
Let's analyze each data series individually:
* **Black Line (Diamond Markers):** This line exhibits the steepest upward trend.
* At approximately 20 (thousands of tokens), Accuracy is around 0.64.
* At approximately 40 (thousands of tokens), Accuracy is around 0.71.
* At approximately 60 (thousands of tokens), Accuracy is around 0.73.
* At approximately 80 (thousands of tokens), Accuracy is around 0.74.
* At approximately 100 (thousands of tokens), Accuracy is around 0.745.
* At approximately 120 (thousands of tokens), Accuracy is around 0.75.
* **Teal Line (Circular Markers):** This line shows a moderate upward trend, leveling off after approximately 60 (thousands of tokens).
* At approximately 20 (thousands of tokens), Accuracy is around 0.58.
* At approximately 40 (thousands of tokens), Accuracy is around 0.62.
* At approximately 60 (thousands of tokens), Accuracy is around 0.64.
* At approximately 80 (thousands of tokens), Accuracy is around 0.645.
* At approximately 100 (thousands of tokens), Accuracy is around 0.65.
* At approximately 120 (thousands of tokens), Accuracy is around 0.65.
* **Red Line (Circular Markers):** This line shows a slow upward trend, leveling off after approximately 40 (thousands of tokens).
* At approximately 20 (thousands of tokens), Accuracy is around 0.55.
* At approximately 40 (thousands of tokens), Accuracy is around 0.60.
* At approximately 60 (thousands of tokens), Accuracy is around 0.61.
* At approximately 80 (thousands of tokens), Accuracy is around 0.62.
* At approximately 100 (thousands of tokens), Accuracy is around 0.63.
* At approximately 120 (thousands of tokens), Accuracy is around 0.64.
* **Blue Line (Square Markers):** This line shows a moderate upward trend, leveling off after approximately 60 (thousands of tokens).
* At approximately 20 (thousands of tokens), Accuracy is around 0.57.
* At approximately 40 (thousands of tokens), Accuracy is around 0.61.
* At approximately 60 (thousands of tokens), Accuracy is around 0.62.
* At approximately 80 (thousands of tokens), Accuracy is around 0.625.
* At approximately 100 (thousands of tokens), Accuracy is around 0.63.
* At approximately 120 (thousands of tokens), Accuracy is around 0.63.
### Key Observations
* The black line consistently demonstrates the highest accuracy across all levels of "Thinking Compute".
* The red line consistently demonstrates the lowest accuracy across all levels of "Thinking Compute".
* All lines exhibit diminishing returns in accuracy as "Thinking Compute" increases beyond approximately 60-80 (thousands of tokens).
* The teal and blue lines show similar performance, with the teal line slightly outperforming the blue line.
### Interpretation
The chart suggests a positive correlation between "Thinking Compute" and "Accuracy", but with diminishing returns. Increasing computational effort (as measured by tokens) initially leads to significant gains in accuracy. However, beyond a certain point, the improvement in accuracy becomes marginal. The black line likely represents a more sophisticated or optimized approach to "thinking" or problem-solving, as it consistently achieves higher accuracy. The red line may represent a baseline or less effective method. The leveling off of all lines indicates that there are inherent limitations to the approach, or that other factors become more important in determining accuracy beyond a certain level of computational effort. This could be due to the complexity of the task, the quality of the data, or the limitations of the underlying model. The differences between the lines suggest that different algorithms or configurations have varying levels of efficiency in utilizing computational resources to achieve accuracy.