## Line Graph: Accuracy vs. Thinking Compute
### Overview
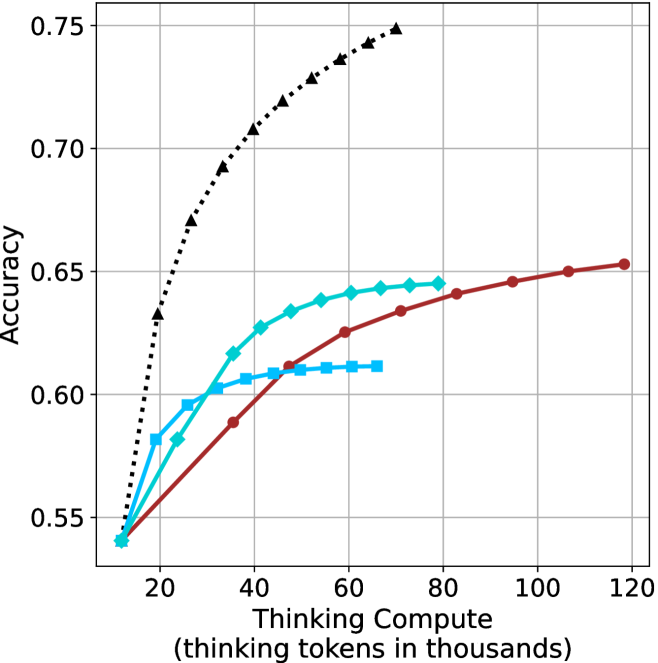
The graph illustrates the relationship between "Thinking Compute" (measured in thousands of thinking tokens) and "Accuracy" across three distinct data series. The x-axis spans from 20 to 120 thousand tokens, while the y-axis ranges from 0.55 to 0.75. Three lines represent different models or configurations, with the black dashed line (triangles) showing the highest accuracy, followed by the teal line (squares), and the red line (circles) with the lowest accuracy.
### Components/Axes
- **X-Axis**: "Thinking Compute (thinking tokens in thousands)" with gridlines at 20, 40, 60, 80, 100, and 120.
- **Y-Axis**: "Accuracy" with gridlines at 0.55, 0.60, 0.65, 0.70, and 0.75.
- **Legend**: Located on the right, with three entries:
- **Black dashed line with triangles**: "Model A" (highest accuracy).
- **Teal line with squares**: "Model B" (mid-range accuracy).
- **Red line with circles**: "Model C" (lowest accuracy).
### Detailed Analysis
1. **Black Dashed Line (Model A)**:
- Starts at (20k, 0.55) and rises sharply to (60k, 0.75), then plateaus with a slight decline to (120k, ~0.73).
- Key data points:
- 20k tokens: 0.55
- 40k tokens: ~0.68
- 60k tokens: 0.75
- 80k tokens: ~0.74
- 100k tokens: ~0.73
- 120k tokens: ~0.73
2. **Teal Line (Model B)**:
- Begins at (20k, 0.55) and increases gradually to (60k, 0.64), then plateaus at ~0.64 until 120k.
- Key data points:
- 20k tokens: 0.55
- 40k tokens: ~0.61
- 60k tokens: 0.64
- 80k tokens: ~0.64
- 100k tokens: ~0.64
- 120k tokens: ~0.64
3. **Red Line (Model C)**:
- Starts at (20k, 0.55) and rises steadily to (120k, 0.65).
- Key data points:
- 20k tokens: 0.55
- 40k tokens: ~0.58
- 60k tokens: ~0.62
- 80k tokens: ~0.64
- 100k tokens: ~0.65
- 120k tokens: 0.65
### Key Observations
- **Model A** achieves the highest accuracy but shows a decline after 60k tokens, suggesting potential overfitting or diminishing returns.
- **Model B** plateaus at ~0.64, indicating limited scalability beyond 60k tokens.
- **Model C** demonstrates consistent improvement but remains the least accurate across all token ranges.
- All models start at the same baseline (0.55 accuracy at 20k tokens), implying similar initial performance.
### Interpretation
The data suggests that increasing thinking compute improves accuracy, but the rate of improvement varies by model. **Model A** initially outperforms others but may suffer from overfitting or resource constraints at higher token counts. **Model B** and **Model C** show more stable scaling, with **Model C** requiring more tokens to achieve comparable accuracy. The plateau in **Model B** and **Model C** highlights potential inefficiencies in resource allocation or algorithmic design. The decline in **Model A** after 60k tokens warrants further investigation into whether this reflects a technical limitation or a trade-off between accuracy and computational cost.