## Diagram: Causal Graph and Jointree Representations
### Overview
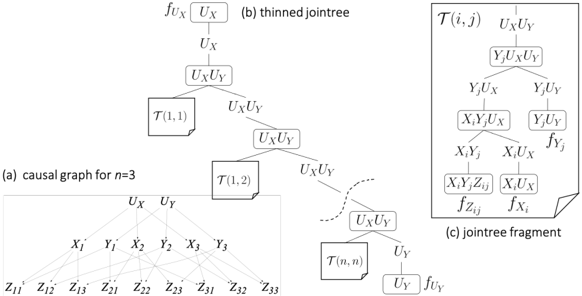
The image presents three related diagrams: a causal graph, a thinned jointree, and a jointree fragment. These diagrams likely represent a probabilistic model or inference process. The causal graph shows dependencies between variables, while the jointrees represent factorizations of the joint probability distribution.
### Components/Axes
* **(a) causal graph for n=3:** This is a directed acyclic graph (DAG) representing causal relationships between variables.
* Nodes: Labeled as U<sub>X</sub>, U<sub>Y</sub>, X<sub>1</sub>, Y<sub>1</sub>, X<sub>2</sub>, Y<sub>2</sub>, X<sub>3</sub>, Y<sub>3</sub>, Z<sub>11</sub>, Z<sub>12</sub>, Z<sub>13</sub>, Z<sub>21</sub>, Z<sub>22</sub>, Z<sub>23</sub>, Z<sub>31</sub>, Z<sub>32</sub>, Z<sub>33</sub>.
* Edges: Represented by lines connecting the nodes, indicating dependencies. U<sub>X</sub> and U<sub>Y</sub> are at the top, followed by X<sub>i</sub> and Y<sub>i</sub>, and then Z<sub>ij</sub> at the bottom.
* **(b) thinned jointree:** This is a tree structure representing a factorization of the joint probability distribution.
* Nodes: Labeled with variable sets (e.g., f<sub>UX</sub> U<sub>X</sub>, U<sub>X</sub>, U<sub>X</sub>U<sub>Y</sub>, U<sub>Y</sub>) or T(i,j) where i and j are indices.
* Edges: Connect the nodes, representing conditional dependencies.
* Nodes are arranged hierarchically, starting from f<sub>UX</sub> U<sub>X</sub> at the top and branching down to T(1,1), T(1,2), and eventually T(n,n) at the bottom.
* **(c) jointree fragment:** This is a detailed view of a portion of a jointree.
* Nodes: Labeled with variable sets (e.g., U<sub>X</sub>U<sub>Y</sub>, Y<sub>j</sub>U<sub>X</sub>, Y<sub>j</sub>U<sub>Y</sub>, X<sub>i</sub>Y<sub>j</sub>U<sub>X</sub>, Y<sub>j</sub>U<sub>Y</sub>, X<sub>i</sub>Y<sub>j</sub>, X<sub>i</sub>U<sub>X</sub>, X<sub>i</sub>Y<sub>j</sub>Z<sub>ij</sub>, X<sub>i</sub>U<sub>X</sub>) or factors (e.g., f<sub>Yj</sub>, f<sub>Zij</sub>, f<sub>Xi</sub>).
* Edges: Connect the nodes, representing conditional dependencies.
### Detailed Analysis or Content Details
* **Causal Graph:**
* U<sub>X</sub> and U<sub>Y</sub> are parent nodes, influencing X<sub>i</sub> and Y<sub>i</sub> respectively.
* X<sub>i</sub> and Y<sub>j</sub> influence Z<sub>ij</sub>.
* The graph is for n=3, indicating three X and Y variables.
* **Thinned Jointree:**
* The tree starts with f<sub>UX</sub> U<sub>X</sub> at the root.
* The tree branches down, with nodes labeled U<sub>X</sub>U<sub>Y</sub>.
* Nodes labeled T(1,1), T(1,2), and T(n,n) are present, suggesting a pattern.
* A dashed line indicates a continuation of the tree structure.
* **Jointree Fragment:**
* The fragment shows a detailed factorization of a portion of the jointree.
* Nodes are labeled with variable sets and factors.
* The structure represents conditional dependencies between variables.
### Key Observations
* The causal graph provides a high-level view of the dependencies between variables.
* The thinned jointree represents a factorization of the joint probability distribution.
* The jointree fragment provides a detailed view of a portion of the jointree.
* The diagrams are related, with the jointrees representing factorizations derived from the causal graph.
### Interpretation
The image illustrates the relationship between a causal graph and its corresponding jointree representation. The causal graph defines the dependencies between variables, while the jointree represents a factorization of the joint probability distribution that respects these dependencies. The thinned jointree provides a simplified view of the jointree, while the jointree fragment shows a detailed portion of the factorization. These diagrams are used in probabilistic inference to efficiently compute probabilities and make predictions. The T(i,j) nodes likely represent intermediate computations or marginalizations over subsets of variables. The dashed line in the thinned jointree indicates that the tree structure continues, suggesting that the full jointree may be more complex than what is shown.