\n
## Diagram: Causal Graph and Jointree Representations
### Overview
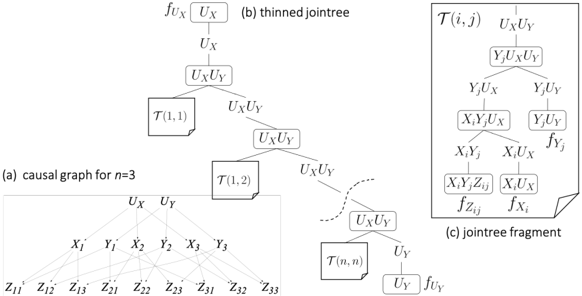
The image presents a diagram illustrating the relationship between a causal graph and its corresponding jointree representation. It shows a causal graph for n=3, a thinned jointree derived from it, and a fragment of the jointree. The diagram uses nodes and edges to represent variables and their dependencies.
### Components/Axes
The diagram is divided into three main sections:
**(a) causal graph for n=3:** This section displays a graph with nodes labeled U<sub>x</sub>, U<sub>y</sub>, X<sub>i</sub>, Y<sub>i</sub>, Z<sub>ij</sub>, and T(1,1), T(1,2), T(n,n). Edges connect these nodes, representing causal relationships.
**(b) thinned jointree:** This section shows a tree-like structure with nodes labeled f<sub>U<sub>x</sub></sub>, U<sub>x</sub>, U<sub>x</sub>U<sub>y</sub>, T(1,1), T(1,2), U<sub>x</sub>U<sub>y</sub>, U<sub>y</sub>, and f<sub>U<sub>y</sub></sub>. The tree structure represents the factorization of the joint distribution.
**(c) jointree fragment:** This section displays a portion of the jointree, with nodes labeled T(i,j), U<sub>x</sub>U<sub>y</sub>, Y<sub>j</sub>U<sub>x</sub>, Y<sub>j</sub>U<sub>y</sub>, X<sub>i</sub>Y<sub>j</sub>U<sub>x</sub>, Y<sub>j</sub>U<sub>y</sub>, X<sub>i</sub>Y<sub>j</sub>Z<sub>ij</sub>, X<sub>i</sub>U<sub>x</sub>, f<sub>Z<sub>ij</sub></sub>, f<sub>X<sub>i</sub></sub>, f<sub>Y<sub>j</sub></sub>.
### Detailed Analysis or Content Details
**(a) Causal Graph for n=3:**
* Nodes: U<sub>x</sub>, U<sub>y</sub>, X<sub>1</sub>, X<sub>2</sub>, X<sub>3</sub>, Y<sub>1</sub>, Y<sub>2</sub>, Y<sub>3</sub>, Z<sub>11</sub>, Z<sub>12</sub>, Z<sub>13</sub>, Z<sub>21</sub>, Z<sub>22</sub>, Z<sub>23</sub>, Z<sub>31</sub>, Z<sub>32</sub>, Z<sub>33</sub>, T(1,1), T(1,2), T(n,n).
* Edges: U<sub>x</sub> is connected to X<sub>1</sub>, X<sub>2</sub>, X<sub>3</sub>. U<sub>y</sub> is connected to Y<sub>1</sub>, Y<sub>2</sub>, Y<sub>3</sub>. X<sub>i</sub> is connected to Z<sub>ij</sub> and Y<sub>j</sub>. Y<sub>j</sub> is connected to Z<sub>ij</sub>. T(1,1) is connected to U<sub>x</sub>U<sub>y</sub>. T(1,2) is connected to U<sub>x</sub>U<sub>y</sub>. T(n,n) is connected to U<sub>y</sub>.
**(b) Thinned Jointree:**
* Root Node: f<sub>U<sub>x</sub></sub>
* Branches:
* f<sub>U<sub>x</sub></sub> -> U<sub>x</sub>
* U<sub>x</sub> -> U<sub>x</sub>U<sub>y</sub>
* U<sub>x</sub>U<sub>y</sub> -> T(1,1)
* U<sub>x</sub>U<sub>y</sub> -> T(1,2)
* U<sub>x</sub>U<sub>y</sub> -> U<sub>x</sub>U<sub>y</sub>
* U<sub>x</sub>U<sub>y</sub> -> U<sub>y</sub>
* U<sub>y</sub> -> f<sub>U<sub>y</sub></sub>
**(c) Jointree Fragment:**
* Root Node: T(i,j)
* Branches:
* T(i,j) -> U<sub>x</sub>U<sub>y</sub>
* U<sub>x</sub>U<sub>y</sub> -> Y<sub>j</sub>U<sub>x</sub>
* U<sub>x</sub>U<sub>y</sub> -> Y<sub>j</sub>U<sub>y</sub>
* Y<sub>j</sub>U<sub>x</sub> -> X<sub>i</sub>Y<sub>j</sub>U<sub>x</sub>
* Y<sub>j</sub>U<sub>y</sub> -> X<sub>i</sub>Y<sub>j</sub>Z<sub>ij</sub>
* X<sub>i</sub>Y<sub>j</sub>U<sub>x</sub> -> X<sub>i</sub>U<sub>x</sub>
* X<sub>i</sub>Y<sub>j</sub>Z<sub>ij</sub> -> f<sub>Z<sub>ij</sub></sub>
* X<sub>i</sub>U<sub>x</sub> -> f<sub>X<sub>i</sub></sub>
* Y<sub>j</sub>U<sub>y</sub> -> f<sub>Y<sub>j</sub></sub>
### Key Observations
* The causal graph represents the dependencies between variables in a probabilistic model.
* The jointree is a tree-like structure that represents the factorization of the joint probability distribution.
* The thinned jointree is a simplified version of the jointree, obtained by eliminating redundant nodes.
* The jointree fragment shows a portion of the complete jointree, illustrating the relationships between specific variables.
* Nodes labeled 'f' likely represent factors in the factorization.
### Interpretation
The diagram illustrates the process of converting a causal graph into a jointree representation, which is a key step in performing inference in probabilistic graphical models. The jointree provides a compact and efficient way to represent the joint probability distribution, allowing for efficient computation of marginal and conditional probabilities. The thinned jointree further simplifies the representation by eliminating redundant nodes, reducing the computational cost of inference. The fragment shows how the jointree can be broken down into smaller components, making it easier to understand and analyze. The diagram demonstrates a fundamental concept in Bayesian networks and graphical models, showing how complex dependencies can be represented and manipulated using tree structures. The use of 'f' nodes suggests a factorization approach, where the joint distribution is expressed as a product of factors associated with the cliques in the jointree.