## Diagram: Icc Controlled Weight Update
### Overview
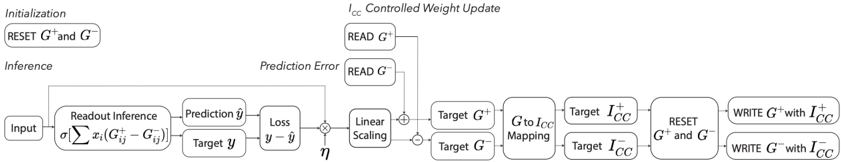
The image is a flowchart illustrating the process of Icc (presumably, "Intra-Class Correlation") controlled weight update in a system involving initialization, inference, and weight adjustment based on prediction error. The diagram shows the flow of data and operations from input to the final weight update.
### Components/Axes
The diagram is divided into three main sections:
1. **Initialization:** Located at the top-left.
2. **Inference:** Located in the middle-left.
3. **Icc Controlled Weight Update:** Located at the top-right and extending to the right side of the diagram.
The diagram uses rounded rectangles to represent processes or operations, and arrows to indicate the flow of data.
### Detailed Analysis or ### Content Details
**1. Initialization:**
* Text: "Initialization"
* Process: "RESET G+ and G-"
**2. Inference:**
* Text: "Inference"
* Input: "Input"
* Process: "Readout Inference" containing the formula: `σ[∑ xi(G+ij - G-ij)]`
* Process: "Prediction ŷ"
* Process: "Target y"
* Process: "Loss" with the formula: `y - ŷ`
**3. Icc Controlled Weight Update:**
* Text: "Icc Controlled Weight Update"
* "Prediction Error" branches off from the "Loss" process.
* Process: "READ G+"
* Process: "READ G-"
* Scaling Factor: "η" (located between the Loss and Linear Scaling)
* Process: "Linear Scaling"
* Process: "Target G+"
* Process: "Target G-"
* Process: "G to Icc Mapping"
* Process: "Target I+CC"
* Process: "Target I-CC"
* Process: "RESET G+ and G-"
* Process: "WRITE G+ with I+CC"
* Process: "WRITE G- with I-CC"
### Key Observations
* The diagram shows a cyclical process where the output of the inference stage is used to update the weights, which then influence subsequent inferences.
* The "Loss" calculation (y - ŷ) is central to the weight update process, as it determines the "Prediction Error" that drives the adjustments.
* The diagram uses G+ and G- to represent positive and negative components, respectively.
* The Icc mapping is used to control the weight update.
### Interpretation
The diagram illustrates a machine learning or neural network training process. The system takes an input, performs inference to generate a prediction (ŷ), compares it to the target (y) to calculate the loss, and then uses this loss to update the weights (G+ and G-) in a controlled manner using the Icc mapping. The initialization step resets the weights, and the final step writes the updated weights back into the system. The use of G+ and G- suggests a mechanism for handling both positive and negative influences on the weights. The Icc controlled weight update likely aims to improve the model's accuracy and generalization by adjusting the weights based on the prediction error and the Icc mapping.