## Density Plot: Cosine Similarity Distributions
### Overview
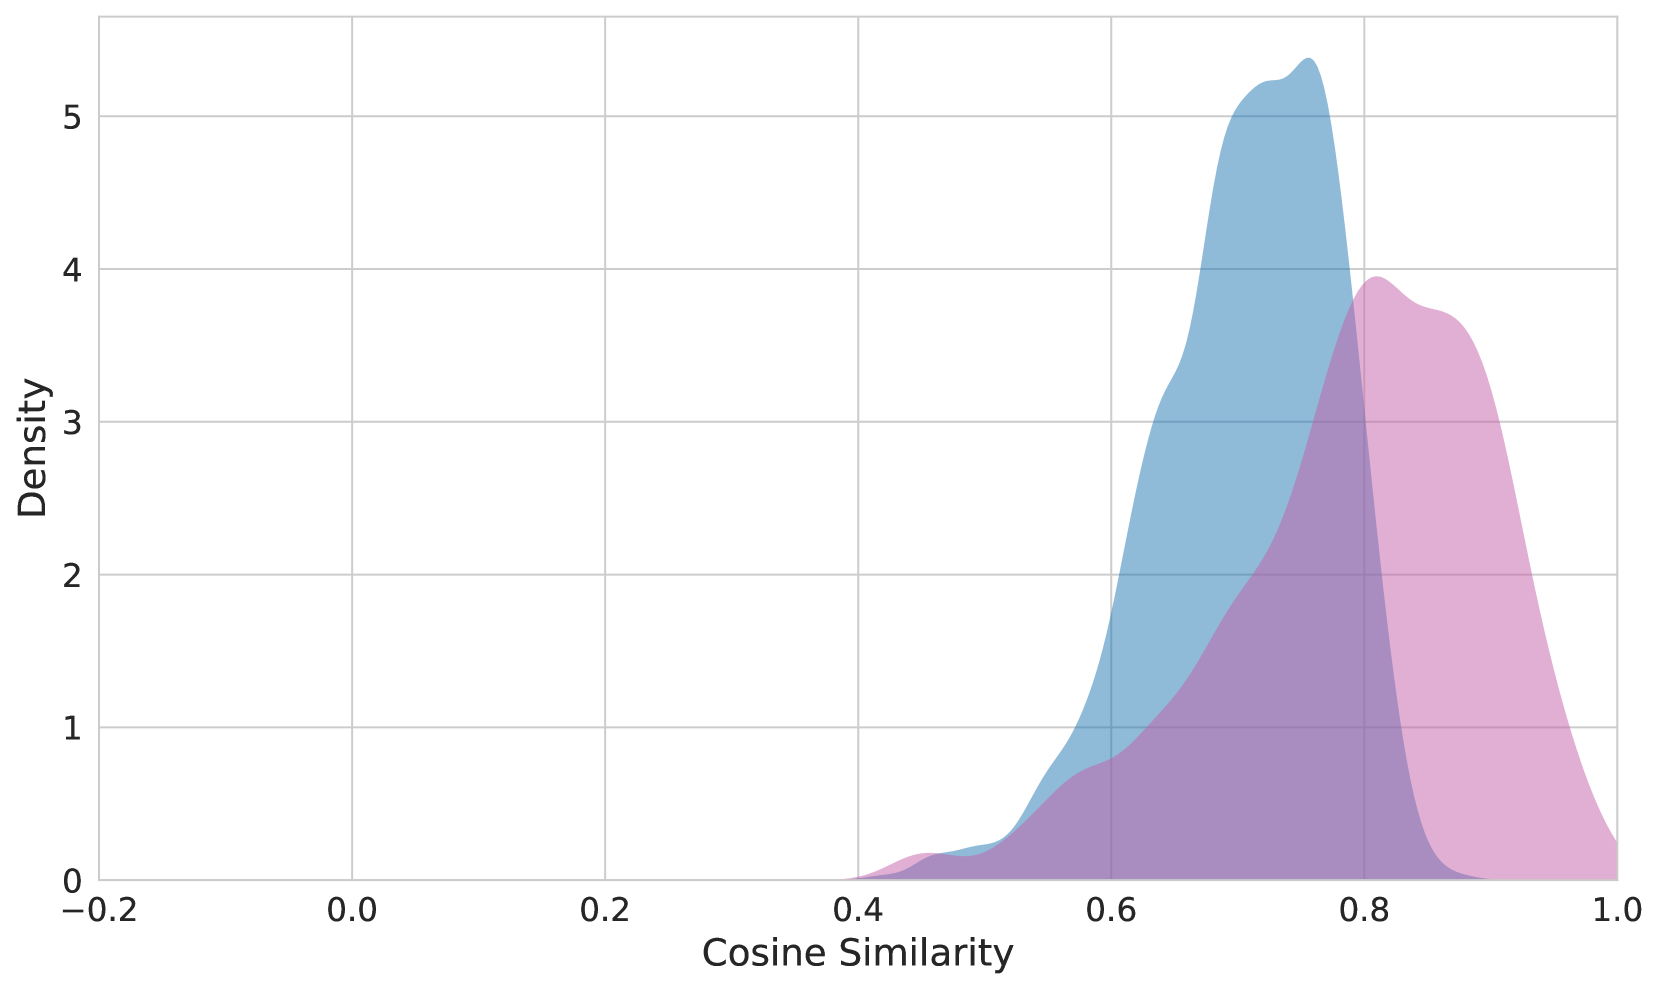
The image is a density plot showing the distribution of cosine similarity scores for two different categories, represented by light blue and light pink. The x-axis represents cosine similarity, ranging from -0.2 to 1.0, and the y-axis represents density, ranging from 0 to 5. The plot shows the probability density of each cosine similarity score for each category.
### Components/Axes
* **X-axis:** Cosine Similarity, ranging from -0.2 to 1.0, with tick marks at -0.2, 0.0, 0.2, 0.4, 0.6, 0.8, and 1.0.
* **Y-axis:** Density, ranging from 0 to 5, with tick marks at 0, 1, 2, 3, 4, and 5.
* **Data Series 1:** Light Blue area plot.
* **Data Series 2:** Light Pink area plot.
* **Gridlines:** Light gray gridlines are present, running parallel to both axes.
### Detailed Analysis
* **Light Blue Distribution:** The light blue distribution starts to rise around a cosine similarity of 0.4, peaks around 0.7, and then decreases. The peak density is approximately 5.3.
* **Light Pink Distribution:** The light pink distribution starts to rise around a cosine similarity of 0.6, peaks around 0.85, and then decreases. The peak density is approximately 4.0.
### Key Observations
* The light blue distribution is shifted to the left compared to the light pink distribution, indicating that the light blue category has lower cosine similarity scores on average.
* The light pink distribution has a higher concentration of scores around its peak compared to the light blue distribution.
### Interpretation
The density plot compares the distributions of cosine similarity scores for two categories. The shift in the light blue distribution towards lower cosine similarity values suggests that, on average, the items in the light blue category are less similar to each other than the items in the light pink category. The higher peak of the light blue distribution indicates a higher frequency of cosine similarity scores around 0.7, while the light pink distribution shows a higher frequency around 0.85. This could imply that the light pink category has a more consistent level of similarity among its items.